In the landscape of enterprise technology, Enterprise Architecture often finds itself at a crossroads. Stakeholders demand tangible results, yet the work of architects can appear abstract and intangible. To bridge this gap, organizations must move beyond qualitative descriptions and adopt quantitative methods. Demonstrating Architecture Value Through ArchiMate Metrics provides a structured approach to quantify the impact of architectural decisions. This guide explores how to measure performance, alignment, and efficiency using the ArchiMate modeling language.
🎯 The Visibility Challenge in Enterprise Architecture
One of the most persistent issues in modern business is the difficulty in tracking the return on investment for architecture initiatives. Without clear indicators, architecture teams risk being viewed as a cost center rather than a strategic enabler. The challenge lies in translating complex technical relationships into business language. Architects need to answer specific questions:
- How does a change in the application landscape affect business agility?
- What is the cost of maintaining technical debt across systems?
- Are we building the right capabilities to support future goals?
Standard reporting often fails to address these queries. Metrics derived from the ArchiMate framework offer a solution. By leveraging the standard notation, organizations can create a consistent vocabulary for measurement. This consistency allows for data aggregation and comparison over time. It transforms architecture from a static documentation exercise into a dynamic management tool.
🧩 Understanding ArchiMate Layers for Measurement
To measure value effectively, one must understand the components being measured. ArchiMate divides the enterprise into distinct layers. Each layer offers unique opportunities for metrics. Aligning metrics with these layers ensures a holistic view of the organization.
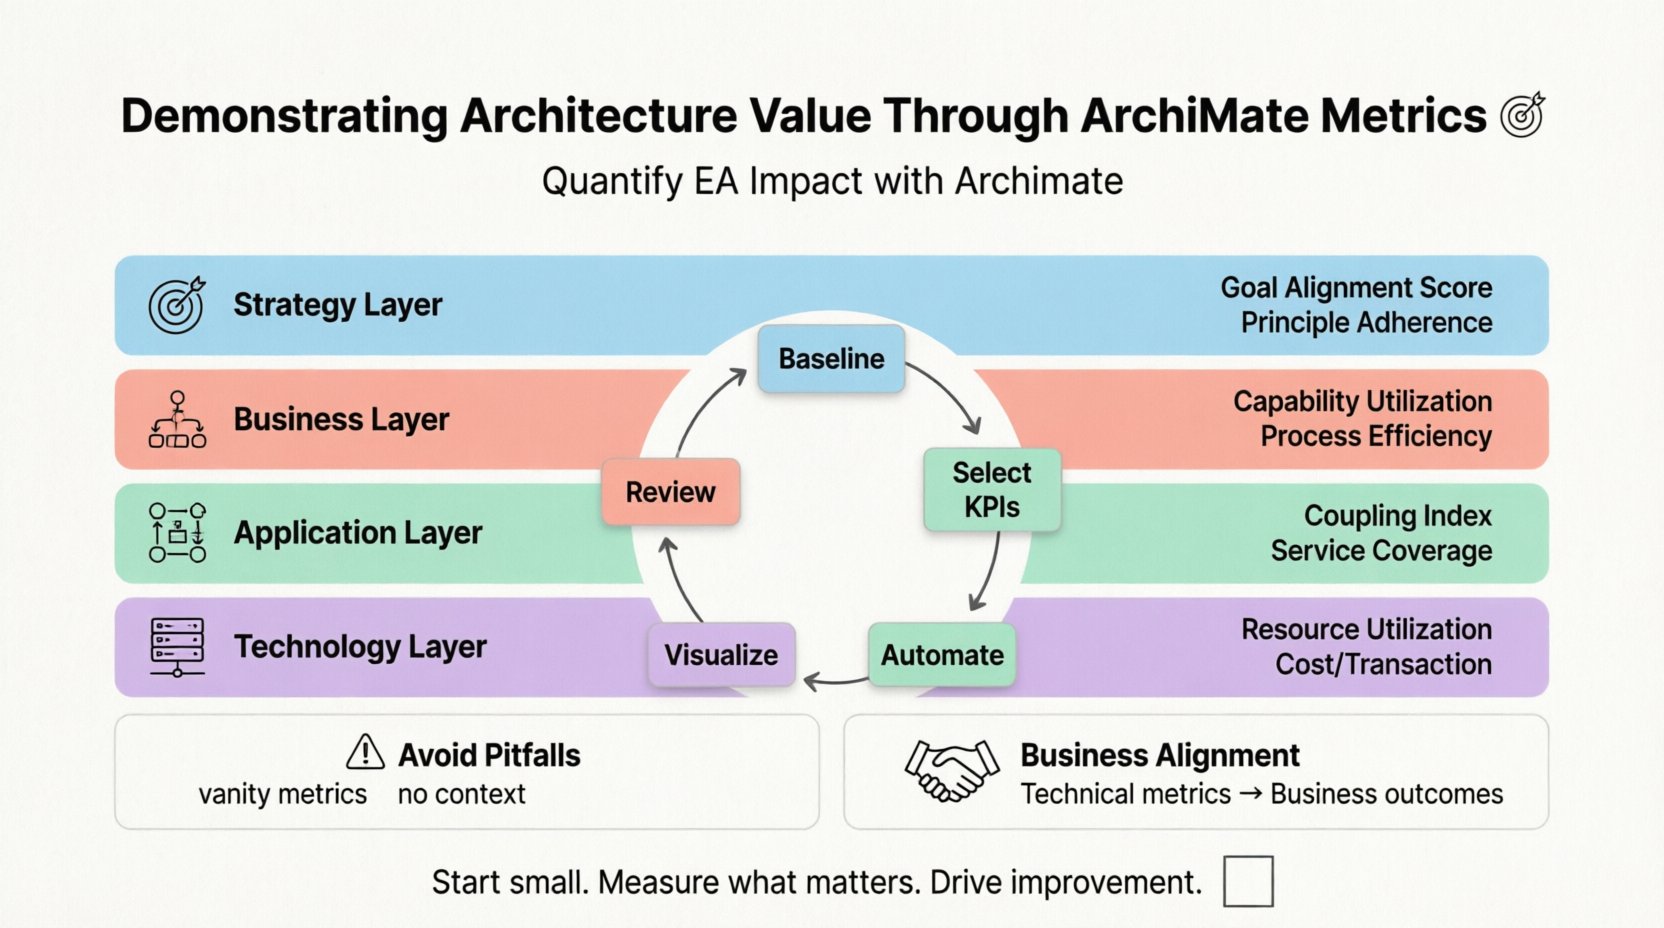
1. Strategy Layer
The Strategy layer defines the direction. It includes elements like Goals, Principles, and Requirements. Metrics here focus on alignment and progress. For instance, tracking the percentage of active projects that support a specific strategic goal is a vital indicator.
2. Business Layer
This layer represents the visible operations. It includes Business Functions, Actors, and Value Streams. Metrics in this area often relate to efficiency and customer impact. Measuring the time it takes to fulfill a value stream is a direct indicator of business performance.
3. Application Layer
Applications support the business processes. They are the software systems used daily. Metrics here focus on stability, coverage, and reuse. High coupling between applications often leads to higher maintenance costs, making coupling metrics essential.
4. Technology Layer
Technology represents the infrastructure. It includes nodes, devices, and networks. Metrics in this domain typically involve availability, latency, and cost per unit of processing.
📈 Strategic Metrics: Motivation and Goals
Value begins at the top. If the architecture does not support the strategy, no amount of optimization in the lower layers will create value. The Motivation layer in ArchiMate is crucial here. It connects goals to capabilities and requirements.
Effective measurement in this layer involves tracking the relationship between objectives and implementation. Consider the following metrics:
- Goal Alignment Score: The percentage of architectural initiatives directly linked to a current strategic goal.
- Requirement Traceability: The ratio of business requirements to implemented architectural components.
- Principle Adherence: The frequency of design decisions that deviate from established architectural principles.
These metrics help leadership understand if the organization is walking the talk. If the Goal Alignment Score is low, it suggests a disconnect between planning and execution. Regular reviews of these metrics ensure that the architecture remains relevant to the business mission.
🏢 Business Layer Metrics: Capabilities and Value Streams
The Business layer is where value is created for the customer. Measuring this layer requires a focus on processes and capabilities. Capabilities define what the business can do, while Value Streams define how value is delivered.
Key metrics for this layer include:
- Capability Utilization: Identifying which business capabilities are over-utilized versus under-utilized.
- Value Stream Efficiency: Measuring the time and cost to deliver a specific value stream outcome.
- Process Redundancy: Counting the number of duplicate processes across different departments.
By tracking capability utilization, architects can identify areas for consolidation. If multiple departments perform the same function independently, there is an opportunity for standardization. This standardization reduces cost and improves consistency. Similarly, analyzing value stream efficiency highlights bottlenecks. If a specific step in a value stream consistently takes longer than the benchmark, it requires investigation and improvement.
🖥️ Application Layer Metrics: Coupling and Coverage
Application software is the backbone of modern operations. However, it is also a primary source of complexity. Application metrics should focus on maintainability and flexibility. The ArchiMate Application Service and Application Function elements provide the structure for this analysis.
Important metrics to consider include:
- Application Coupling: The number of dependencies between applications.
- Service Coverage: The percentage of business processes supported by automated applications.
- Technology Obsolescence: The count of applications using outdated technology stacks.
High coupling is a significant risk. When applications are tightly linked, a change in one system can cause failures in another. Reducing coupling increases resilience. Service coverage metrics show how much of the business is digitized. Low coverage might indicate manual workarounds that introduce error. Technology obsolescence metrics help plan for migration. Systems running on unsupported platforms pose security and stability risks.
🔌 Technology Layer Metrics: Infrastructure and Performance
The Technology layer supports the applications. While this layer is often managed by IT Operations, architecture metrics ensure that infrastructure decisions align with long-term goals. Metrics here should reflect capacity and cost.
Relevant metrics include:
- Resource Utilization: The percentage of server capacity being used.
- Network Latency: The time taken for data to travel between nodes.
- Cost Per Transaction: The infrastructure cost divided by the number of transactions processed.
Resource utilization helps in capacity planning. Under-utilized resources waste budget, while over-utilized resources risk performance degradation. Network latency impacts user experience. If latency is high, business processes slow down. Cost per transaction provides a clear view of efficiency. It allows comparison between different infrastructure setups to find the most cost-effective solution.
📊 Measurement Framework Structure
To implement these metrics, a framework is necessary. Random data collection leads to noise. A structured approach ensures data quality and relevance. The following table outlines a basic framework for categorizing metrics.
| Metric Category | Focus Area | Example Metric | Target Audience |
|---|---|---|---|
| Strategic | Alignment | Goal Achievement Rate | Executive Leadership |
| Business | Efficiency | Value Stream Cycle Time | Business Process Owners |
| Application | Maintainability | Application Coupling Index | CTO / CIO |
| Technology | Performance | System Uptime Percentage | IT Operations |
This table demonstrates how metrics map to different stakeholders. Executives care about strategic alignment. Business owners care about process speed. Technical leaders care about system health. A unified framework allows all parties to see the same data in different contexts. This shared understanding reduces friction and improves collaboration.
🚀 Implementing a Measurement Framework
Building the framework is only the first step. Implementation requires discipline and integration. The following steps guide the process.
Step 1: Define the Baseline
Before measuring change, you must know the current state. Document the existing architecture using the ArchiMate language. Ensure all relationships are recorded. This creates the baseline against which future changes are measured.
Step 2: Select Key Indicators
Do not measure everything. Too many metrics create noise. Select a small set of Key Performance Indicators (KPIs) that matter most. Focus on metrics that drive behavior. If a metric does not influence a decision, it should be discarded.
Step 3: Automate Data Collection
Manual data entry is prone to error and delay. Where possible, integrate architecture data with operational data. Connect the modeling environment with monitoring tools. This ensures that metrics are updated in real-time or near real-time.
Step 4: Visualize and Report
Data must be presented clearly. Dashboards are effective for this purpose. Visualizations should highlight trends rather than static snapshots. Use graphs to show progress over time. Highlight deviations from the baseline immediately.
Step 5: Review and Iterate
Metrics should not be static. As the business evolves, so should the metrics. Schedule regular reviews to assess if the metrics are still relevant. Remove metrics that no longer provide value and add new ones as needed.
🛡️ Data Collection and Reporting
Reporting is where the value becomes visible. The audience determines the format. Executives need high-level summaries. Technical teams need granular details. A tiered reporting structure is recommended.
- Executive Dashboard: One-page summary showing strategic alignment and major risks.
- Managerial Report: Detailed breakdown by department or capability area.
- Technical Log: Raw data and change logs for audit purposes.
Transparency is key. All stakeholders should have access to the data. Hiding metrics creates suspicion. Open access builds trust. When stakeholders see the data, they can verify the claims. This accountability drives better decision-making across the organization.
⚠️ Common Pitfalls to Avoid
Even with a good framework, mistakes can occur. Awareness of common pitfalls helps avoid them.
- Vanity Metrics: Focus on metrics that look good but do not reflect reality. For example, counting the number of models created does not indicate value.
- Lack of Context: Numbers without context are meaningless. Always explain what a metric represents and why it matters.
- Ignoring Quality: High speed is not valuable if the output is incorrect. Measure both speed and accuracy.
- Over-Engineering: Do not build complex measurement systems for simple problems. Keep the solution proportional to the challenge.
🔄 Sustaining Architecture Value Over Time
Architecture is not a one-time project. It is an ongoing practice. To sustain value, the measurement process must become part of the culture. It should not be an extra task but an integrated activity.
Embed metrics into the change management process. Every significant change should be evaluated against the metrics. If a change improves a metric, it is a positive step. If it degrades a metric, it requires justification. This integration ensures that architecture remains a priority in daily operations.
Training is also essential. Staff members need to understand how to use the metrics. Workshops and documentation help spread this knowledge. When everyone understands the language of measurement, the organization becomes more agile.
🌐 The Role of Automation
Automation plays a critical role in modern architecture measurement. Manual tracking is unsustainable at scale. Automated tools can scan code repositories, infrastructure configurations, and process logs. They extract data and map it to the ArchiMate model.
This automation reduces the burden on architects. It allows them to focus on analysis rather than data gathering. It also increases accuracy. Human error is minimized. Automated alerts can notify teams when a metric crosses a threshold. This proactive approach prevents issues before they become critical.
🤝 Aligning with Business Outcomes
The ultimate goal of these metrics is to align with business outcomes. Technical metrics must translate to business value. For example, reducing application coupling is a technical win. The business outcome is faster time-to-market for new features.
Communication is the bridge between these two worlds. Architects must articulate the business impact of technical metrics. Instead of saying “Coupling reduced by 20%”, say “Deployment time reduced by 20%, enabling faster feature release”. This translation makes the value clear to non-technical stakeholders.
📝 Final Considerations
Demonstrating architecture value requires discipline, clarity, and consistency. ArchiMate provides the structure needed to organize this work. By focusing on metrics across all layers, organizations can gain a comprehensive view of their capabilities.
Start small. Pick a few key metrics and refine the process. Expand the scope as the team gains confidence. Remember that the goal is not just measurement, but improvement. Use the data to make better decisions. Let the metrics guide the evolution of the enterprise.
The path to value is continuous. It requires ongoing attention and adaptation. With the right framework in place, architecture becomes a driver of business success. It transforms from a support function into a strategic asset. This shift is the true measure of success in enterprise architecture.

