Understanding your position within a market requires more than just looking at revenue or market share. It demands a structural view of how value is created, delivered, and captured. This is where the Business Model Canvas (BMC) becomes an indispensable tool for competitive analysis. By mapping competitors using the same framework, organizations can identify strategic gaps, uncover hidden threats, and spot opportunities for differentiation.
Traditional analysis often focuses on financial statements or product features. While valuable, these snapshots miss the underlying logic of the business. The BMC reveals the architecture. When you apply this framework to rivals, you move beyond surface-level comparisons to understand the mechanics of their success and failure. This guide details how to execute this process effectively without relying on proprietary software, focusing on methodology and strategic insight.
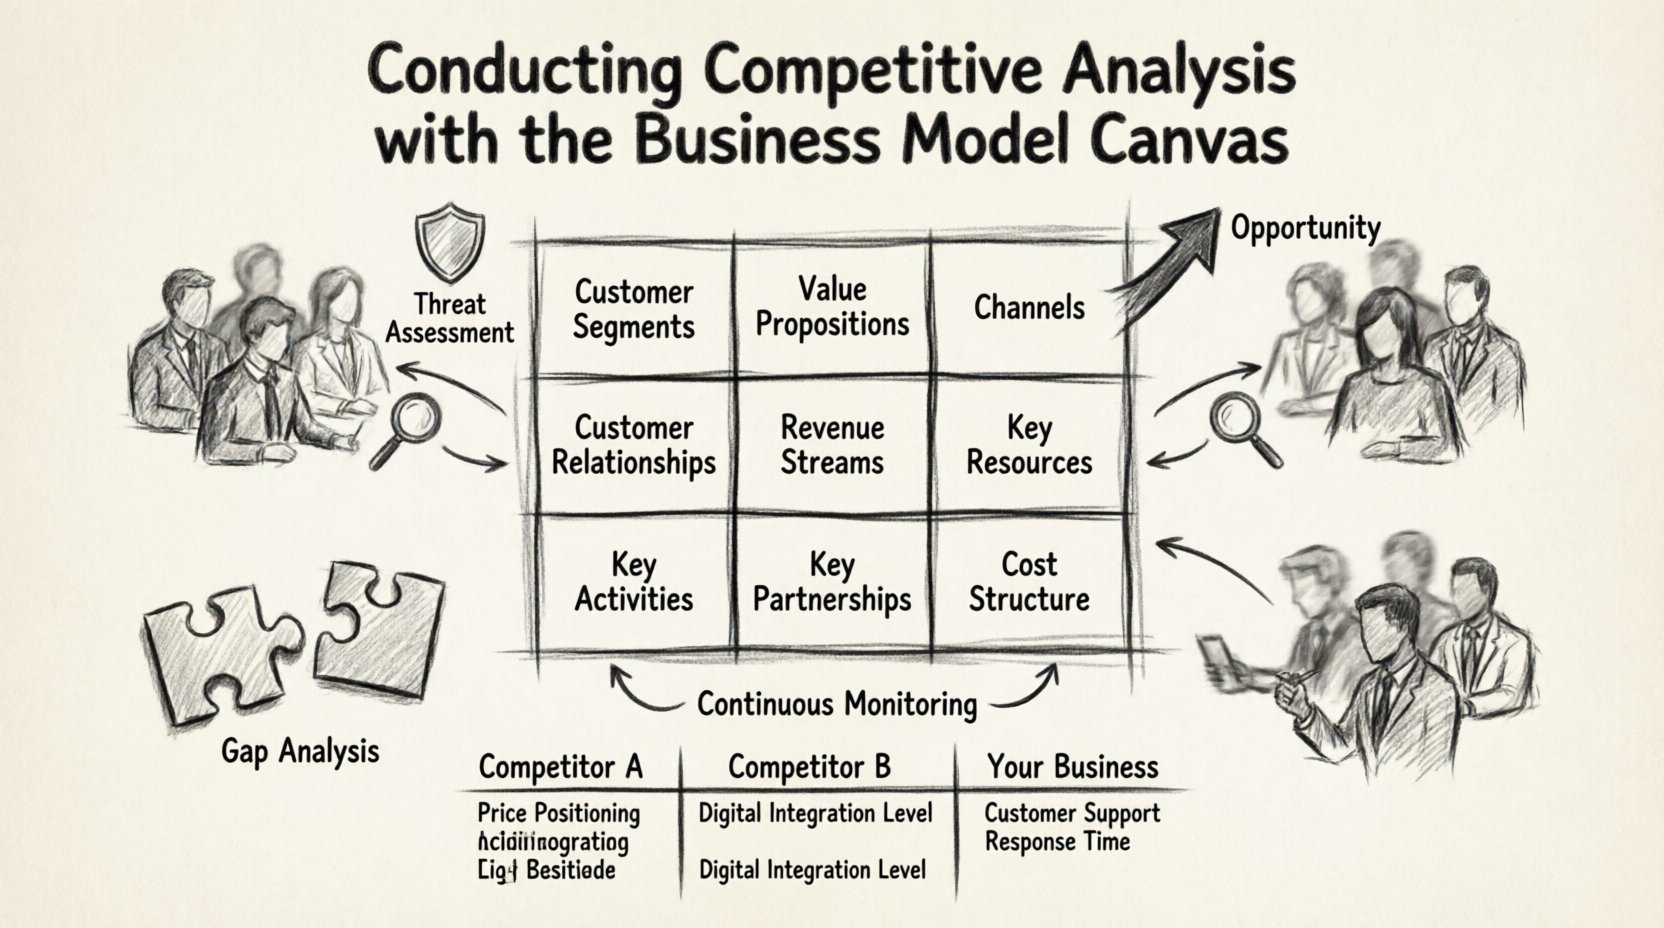
🔍 Why Use the Business Model Canvas for Competitor Mapping?
Standard competitive analysis often results in a list of pros and cons. The BMC transforms this into a visual and structural comparison. It forces analysts to consider nine distinct building blocks rather than just one or two metrics. This holistic approach ensures that no critical aspect of the business is overlooked.
- Structural Clarity: It organizes complex business information into a digestible format.
- Comparability: Using the same template for your business and your rivals allows for direct, block-to-block comparison.
- Strategic Insight: It highlights where value flows and where costs accumulate, revealing efficiency gaps.
- Dynamic View: It captures relationships between different parts of the business, such as how a change in channels affects customer relationships.
When you map competitors this way, you stop asking “Are they cheaper?” and start asking “How do their cost structures allow them to be cheaper without sacrificing margins?” This distinction is vital for long-term planning.
🏗️ The Nine Building Blocks Explained for Analysis
To conduct a thorough analysis, you must understand what each block represents in a competitive context. Here is a breakdown of how to evaluate each component against your rivals.
1. Customer Segments 👥
Who does the competitor serve? Are they targeting mass markets or niches? Look for overlaps in your own customer base. If a competitor targets the same demographic but uses a different value proposition, they are a direct threat. Analyze their focus:
- Are they targeting early adopters or the mainstream market?
- Do they serve B2B or B2C clients?
- Are they focusing on high-volume, low-margin customers or high-value, low-volume clients?
2. Value Propositions 💡
This is the core of your competitive advantage. What problem are they solving? Why do customers choose them over you? Evaluate their offerings:
- Novelty: Do they offer something new?
- Performance: Is their product faster or more reliable?
- Customization: Do they tailor solutions to specific needs?
- Price: Are they the low-cost leader?
- Design: Is their aesthetic a key selling point?
3. Channels 📢
How do they reach their customers? This block reveals their marketing and distribution strategy. You might find they rely heavily on direct sales while you depend on partnerships. Understanding their channel mix helps you anticipate market shifts.
- Do they use online marketplaces or a proprietary storefront?
- Is their presence physical, digital, or both?
- How do they handle logistics and delivery?
4. Customer Relationships 🤝
How do they acquire and retain customers? This indicates their customer service philosophy and retention strategy.
- Personal Assistance: Do they offer human support?
- Self-Service: Do they rely on automated tools?
- Automated Services: Is the experience entirely algorithmic?
- Communities: Do they build user groups or forums?
5. Revenue Streams 💰
How do they make money? This block is critical for understanding their financial health and sustainability. Look beyond just product sales.
- Asset Sale: Selling physical goods.
- Usage Fee: Charging based on consumption.
- Subscription: Recurring revenue models.
- Licensing: Intellectual property rights.
- Advertising: Selling attention.
6. Key Resources 🛠️
What assets do they need to make the model work? This includes physical, intellectual, human, and financial resources. Identifying their core resources helps you understand their barriers to entry.
- Do they own their infrastructure or outsource it?
- Do they hold patents or proprietary data?
- Is their workforce a key differentiator?
7. Key Activities ⚙️
What things must the business do to operate? This covers production, problem-solving, and platform management. If a competitor focuses heavily on R&D while you focus on sales, your strategic priorities differ significantly.
- Are they manufacturing or assembling?
- Do they focus on platform maintenance?
- Is their activity primarily problem-solving or support?
8. Key Partnerships 🤝
Who helps them succeed? No business is an island. Understanding their supply chain and alliances reveals their dependencies and potential vulnerabilities.
- Who are their suppliers?
- Do they have strategic alliances with competitors?
- Are they part of a larger ecosystem?
9. Cost Structure 💸
What are the most important costs inherent in the business model? This block reveals their operational efficiency. A competitor with a lean cost structure can undercut prices or invest more in growth.
- Are they cost-driven or value-driven?
- Where do their largest expenses lie?
- Do they benefit from economies of scale?
📋 Step-by-Step Process for BMC Competitive Analysis
Executing this analysis requires a disciplined approach. Follow these steps to ensure accuracy and actionable results.
Step 1: Identify the Competitors 🎯
Start by listing direct and indirect competitors. Direct competitors offer the same product to the same audience. Indirect competitors solve the same problem with a different solution. Include potential disruptors who are not currently in the market but could enter.
Step 2: Gather Data 📝
Collect information from public sources. You do not need paid tools for this. Use:
- Company websites and landing pages.
- Annual reports and investor presentations.
- Customer reviews and testimonials.
- Social media channels and engagement metrics.
- Job postings to identify key resources and activities.
- Press releases and news articles.
Step 3: Map the Blocks 🗺️
Create a visual canvas for your own business. Then, create identical canvases for your top three competitors. Fill in the blocks using the data gathered. Be honest. If you do not know a specific detail, mark it as “Unknown” rather than guessing.
Step 4: Compare and Contrast 🔄
Place the canvases side by side. Look for patterns. Where do they differ significantly? Where are they identical? Focus on the areas where your competitors have an advantage and areas where they have a disadvantage.
📊 Visualizing the Comparison
A table is an efficient way to summarize findings across competitors. Below is a simplified example of how to structure your data for quick reference.
| Building Block | Competitor A | Competitor B | Your Business |
|---|---|---|---|
| Value Proposition | Low cost, basic features | High quality, premium support | Balance of cost and quality |
| Revenue Model | One-time purchase | Monthly subscription | Freemium with upgrade path |
| Key Channels | Online ads only | Direct sales team | Partnerships + Online |
| Cost Structure | Low fixed costs | High fixed costs | Variable costs |
| Customer Relationship | Self-service | Personal account manager | Hybrid support model |
This table allows stakeholders to see at a glance where the market stands. It highlights that Competitor A is efficient but lacks support, while Competitor B is robust but expensive. Your position is the balance.
🧠 Identifying Gaps and Opportunities
Once the mapping is complete, the analysis phase begins. You are looking for white space. This is where innovation happens. Look for mismatches between what competitors offer and what customers actually need.
1. Service Gaps 🛑
Do competitors ignore a specific customer segment? Perhaps they focus on large enterprises and ignore small businesses. This creates an opening for you to dominate the smaller segment.
2. Channel Gaps 🚀
Are competitors relying on a single channel? If they only sell online, a competitor introducing a physical presence could capture local trust. Conversely, if they are physical-only, a digital-first approach could reduce overhead.
3. Revenue Model Gaps 💳
Is the entire market using a subscription model? Introducing a pay-per-use model might attract cost-conscious customers who fear long-term commitments. Or, moving to a subscription might provide more predictable revenue for everyone involved.
4. Partnership Gaps 🤝
Do your rivals rely on a single supplier? This creates risk. If you secure a contract with a different, more reliable partner, you can offer stability as a selling point. Look for alliances they have not yet formed.
🛡️ Assessing Threats and Vulnerabilities
Analysis is not just about finding your own opportunities; it is about understanding where you are at risk. Use the canvas to stress-test your position.
- Resource Dependency: Does a competitor own a key resource you need? If so, they hold leverage over your supply chain.
- Channel Control: If a competitor controls a major distribution channel, they can block your access to customers.
- Cost Leadership: If a competitor has significantly lower costs, they can engage in a price war that you might not survive.
- Switching Costs: Check the “Customer Relationships” block. If competitors have high switching costs (e.g., proprietary data lock-in), it is hard to steal their customers.
🚀 Implementing Findings into Strategy
Data is useless without action. Once you have identified the gaps and threats, you must adjust your own Business Model Canvas. This is not about copying your rivals, but about adapting to the reality of the market.
Refining Your Value Proposition
If competitors are all fighting on price, do not join them. Shift your value proposition to quality, speed, or service. If they are all service-heavy, lean into automation and self-service to reduce costs.
Optimizing Cost Structures
If your rivals are more efficient, analyze their Key Activities. Can you automate a process? Can you outsource a non-core function? Look for ways to reduce waste without compromising your output.
Diversifying Revenue Streams
Do not rely on a single income source. If your analysis shows competitors are diversifying, you should too. Add complementary services or products to your model to stabilize cash flow.
Strengthening Partnerships
Identify partners your competitors are ignoring. Secure these relationships before they do. A strong network can act as a barrier to entry for new rivals.
🔄 Continuous Monitoring
Business models are not static. Markets change, technologies evolve, and customer needs shift. A one-time analysis is insufficient. Treat the Business Model Canvas as a living document.
- Quarterly Reviews: Revisit your canvases every quarter. Update the data as new information becomes available.
- Trigger Events: If a competitor launches a new product or changes pricing, immediately update their canvas.
- Internal Changes: When you change your own model, check how it affects your competitive standing.
Regular monitoring ensures that you remain agile. It allows you to react to market shifts before they become existential threats. By keeping your competitors mapped, you maintain a clear view of the landscape.
⚠️ Common Pitfalls to Avoid
Even with a robust framework, analysts can make mistakes. Be aware of these common errors to ensure your analysis remains accurate.
- Over-reliance on Public Data: Public information is often outdated or marketing fluff. Cross-reference with customer feedback and industry reports.
- Confirmation Bias: Do not look only for data that confirms your beliefs. Be willing to acknowledge where competitors are winning.
- Ignoring Indirect Competitors: A startup might not sell the same product but solves the same problem. They are a threat even if they do not fit the traditional definition.
- Static Analysis: Do not assume the map is correct forever. Markets are dynamic. Update your assumptions regularly.
- Focusing Only on Costs: Do not ignore revenue models. A high-cost business can be profitable if their revenue model is strong. Look at the whole picture.
📈 Conclusion
Conducting competitive analysis using the Business Model Canvas provides a depth of understanding that traditional methods cannot match. It moves the conversation from simple feature lists to structural logic. By examining the nine building blocks, you gain insight into how value is created and captured in the market.
This approach empowers you to make informed decisions. It highlights where you stand, where your rivals stand, and where the opportunities lie. Whether you are refining your current strategy or planning a new venture, this framework offers a clear path forward. Use it to navigate the complexities of the market with confidence and precision.
Remember, the goal is not to defeat competitors but to build a sustainable model that serves your customers better. Use these insights to innovate, adapt, and grow. The landscape will always change, but a structured approach to analysis ensures you are always prepared for what comes next.

