Software architecture is more than just lines of code. It is the blueprint of your system, the map that guides developers, stakeholders, and operations teams through complexity. When systems grow, documentation often becomes the first casualty. Diagrams get outdated, labels become vague, and understanding the flow of data turns into a guessing game. This is where the C4 Model steps in to provide clarity without the noise.
The C4 Model offers a structured approach to visualizing software architecture. It moves beyond simple box-and-line drawings to tell a story about how a system works. By separating concerns into four distinct levels, it allows teams to communicate effectively at different stages of development and across different audiences. This guide walks through every layer, explaining how to apply them in practice without relying on specific tools or marketing fluff.
What is the C4 Model? 🧩
The C4 Model was created to address the fragmentation in how software architecture is documented. Before its widespread adoption, teams often struggled with diagrams that were either too high-level to be useful or too detailed to provide an overview. The model standardizes the vocabulary used to describe system components.
It is named after its four levels of detail:
- Level 1: Context
- Level 2: Container
- Level 3: Component
- Level 4: Code
Each level serves a specific purpose and targets a specific audience. The goal is not to create a massive document, but to maintain a living set of diagrams that evolve alongside the code. This ensures that the documentation remains accurate and valuable over time.
Level 1: System Context 🌍
The System Context diagram provides the highest level of abstraction. It answers the question: “How does this system fit into the wider world?” This diagram is typically the first one created during the planning phase of a project.
Who reads this?
- Non-technical stakeholders
- Product owners
- Business analysts
- New team members
Key Elements
A context diagram consists of three types of elements:
- The System: The software being designed. It is usually represented as a single box in the center.
- People: Users or actors who interact with the system. These could be end-users, administrators, or external operators.
- Other Systems: External services or applications that the system communicates with. Examples include payment gateways, email providers, or legacy databases.
Arrows connect these elements to show the direction of data flow. Labels on the arrows describe what is being passed, such as “User Credentials” or “Payment Data”. This level avoids technical jargon entirely. There is no mention of APIs, databases, or specific protocols here.
Example Scenario
Imagine an online store. The context diagram shows the “Online Store” system in the middle. On the left, there is a “Customer” person icon. On the right, there are “Payment Provider” and “Inventory System” boxes. Arrows show the customer sending an order, the store sending payment requests, and the inventory system receiving updates. This gives a clear view of boundaries and interactions without diving into implementation details.
Level 2: Container 📦
Once the context is understood, the focus shifts inward. The Container level breaks down the single system box from Level 1 into multiple distinct parts. A container is a runtime environment. It is a deployed unit of software that processes data and persists data.
Who reads this?
- Developers
- DevOps engineers
- System Architects
- QA Engineers
Defining Containers
A container is not a microservice, though microservices are often containers. It is a broader term. Examples include:
- Web applications
- Mobile applications
- APIs
- Database servers
- Desktop applications
- Batch jobs
Each container has a specific purpose. It uses specific technologies, such as a programming language or a database engine. However, the diagram does not need to list every library used. It focuses on the boundary of the container and how it interacts with other containers.
Interactions
Connections between containers are critical. They define the architecture’s integration points. Common protocols include:
- HTTP/HTTPS (RESTful APIs)
- gRPC
- Message Queues (e.g., AMQP, Kafka)
- Database protocols
When drawing this level, label the connections clearly. Do not just draw a line. Write “Reads Order Data” or “Writes Log Files”. This clarifies the intent behind the connection.
Level 3: Component 🧱
Containers can be complex. To understand what happens inside a container, the C4 Model introduces the Component level. A component is a logical grouping of functionality within a container. It is a unit of code that performs a specific task.
Who reads this?
- Software Developers
- Team Leads
- Technical Reviewers
Granularity
Components are more detailed than containers but less detailed than code. They represent classes, modules, or packages. The goal is to show the internal structure of a container without overwhelming the reader with every single function.
For a web application container, components might include:
- Authentication Module: Handles login and session management.
- API Controller: Receives and routes incoming requests.
- Data Access Layer: Interacts with the database.
- Business Logic: Processes rules and calculations.
Relationships
Components interact with each other to achieve the container’s goal. These interactions can be synchronous (calls) or asynchronous (events). It is important to show dependencies. If Component A relies on Component B, draw a line between them. This helps identify coupling and potential bottlenecks.
When creating component diagrams, group related components visually. Use lines to separate logical sections within the container box. This makes the diagram readable even when the number of components is large.
Level 4: Code 💻
Level 4 is optional. It represents the actual code level. This includes classes, methods, and variables. For most teams, this level is unnecessary because it duplicates the information found in the source code itself.
When to use it
- Complex algorithms that are hard to explain in comments
- Legacy code refactoring
- Training new developers on specific logic
- Security reviews requiring deep inspection
Usually, developers refer to the code directly rather than a diagram. If a diagram is needed, it should be generated from the code (e.g., via static analysis) to ensure it stays up to date. Manual maintenance of Level 4 diagrams is rarely sustainable.
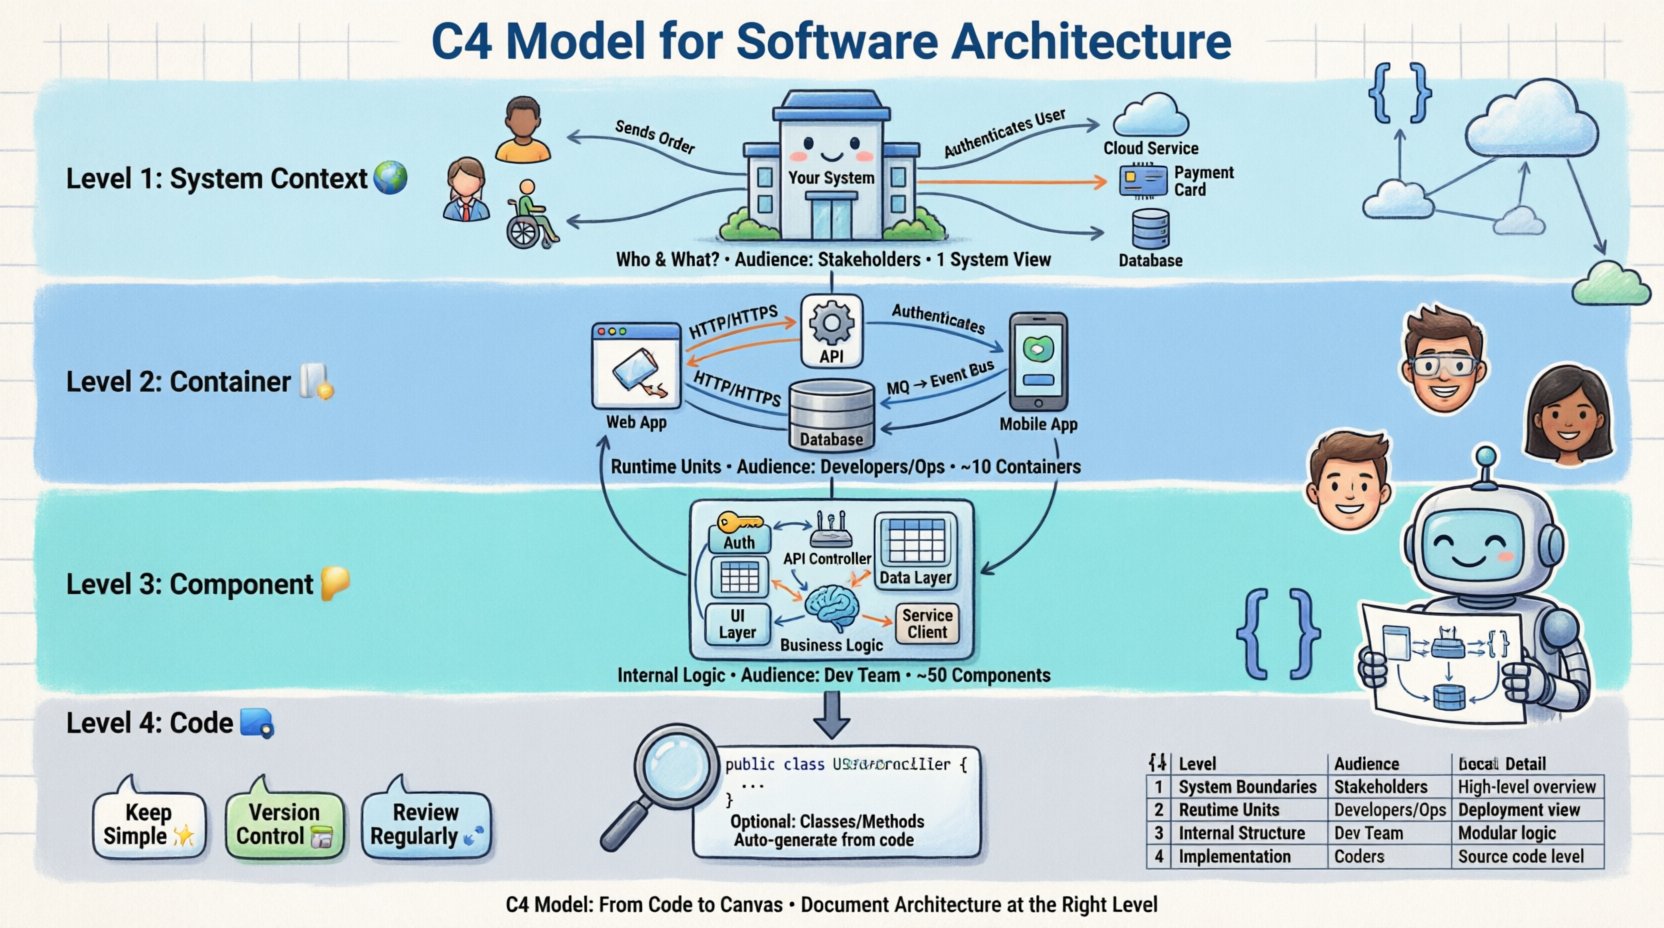
Comparison of Levels ⚖️
To summarize the differences, refer to the table below. It highlights the audience, detail, and typical size for each level.
| Level | Focus | Typical Audience | Detail Level |
|---|---|---|---|
| 1. Context | System boundaries | Stakeholders, Management | High (1 System) |
| 2. Container | Technical runtime | Developers, Ops | Medium (10 Containers) |
| 3. Component | Internal logic | Developers | Low (50 Components) |
| 4. Code | Implementation | Specialized Review | Very Low (Classes/Methods) |
Best Practices for Documentation 📝
Creating diagrams is only half the battle. Keeping them accurate is the challenge. Here are strategies to maintain high-quality architecture documentation.
1. Keep it Simple
Avoid clutter. If a diagram has more than 20 elements, it is likely too complex. Split it into multiple diagrams or simplify the abstraction level. Use color to distinguish types of elements, but do not overuse it. Stick to a consistent color scheme across all diagrams.
2. Version Control
Treat diagrams as code. Store them in the same repository as the source code. This allows you to track changes over time and revert if necessary. Commit messages should explain why the diagram changed, not just that it changed.
3. Focus on Flow
Diagrams should tell a story. The flow of data should be easy to follow. Use arrows consistently. Ensure the direction of data flow makes sense for the specific context. Avoid bidirectional arrows unless the interaction is truly symmetric.
4. Review Regularly
Set a schedule for reviewing architecture diagrams. This could be during sprint planning or code reviews. If a diagram does not match the current state of the system, update it immediately. Outdated diagrams are worse than no diagrams because they create false expectations.
Common Pitfalls to Avoid ⚠️
Even experienced architects make mistakes when documenting systems. Being aware of common traps helps prevent them.
- Mixing Levels: Do not put code details in a context diagram. Do not show external systems in a component diagram. Keep the levels distinct to maintain clarity.
- Ignoring Non-Functional Requirements: Diagrams often show functionality but miss constraints. Consider adding notes about latency, security, or scalability requirements near the relevant components.
- Over-Engineering: Do not create a diagram for every single feature. Focus on the core architecture. Feature-specific details can be handled in separate documents or within the code.
- Static Images: Avoid generating static images that cannot be edited. Use tools that allow for versioning and collaboration. If you cannot edit the diagram, it will rot.
- Lack of Legend: Always provide a key if you use specific shapes or colors. If a circle means “Database” in one diagram, it should mean “Database” in all diagrams.
Integrating into the Workflow 🔄
Architecture documentation should not be a separate phase. It should be integrated into the daily development process. Here is how to align the C4 Model with modern workflows.
During Design
Before writing code, sketch the Level 1 and Level 2 diagrams. This helps identify missing dependencies or unclear boundaries early. It reduces the risk of major refactoring later in the project.
During Development
When adding a new feature, update the Level 3 diagram if the internal structure changes. If a new container is introduced, update the Level 2 diagram. This incremental approach prevents documentation debt from accumulating.
During Deployment
Ensure the deployment pipeline reflects the architecture. If the diagram shows three containers, the deployment script should deploy three units. Mismatches here indicate configuration drift.
Onboarding
Use the C4 diagrams as the primary resource for new hires. It provides a faster ramp-up time than reading code alone. A new developer can understand the system landscape in hours rather than weeks.
Conclusion on Architecture Clarity 🧭
Documentation is a tool for communication, not a barrier to entry. The C4 Model provides a structured way to manage complexity without getting lost in the details. By separating concerns into Context, Container, Component, and Code, teams can share knowledge effectively.
The value of this approach lies in its flexibility. It adapts to the size of the team and the complexity of the system. Whether the team is small or large, the principles remain the same: define boundaries, show connections, and maintain accuracy.
Start small. Create a Level 1 diagram today. Review it with a stakeholder. Then move to Level 2. The journey from code to canvas is iterative. It requires discipline, but the payoff is a system that is easier to understand, maintain, and evolve. Focus on the story the diagram tells, and let the technical details support that narrative.
Architecture is a continuous conversation. Keep the diagrams alive, and keep the conversation flowing.

