Software systems are becoming increasingly intricate. As architectures grow, the gap between high-level vision and low-level implementation widens. Developers, architects, and stakeholders often struggle to maintain a shared understanding of how a system functions. This is where the C4 Model steps in. It offers a structured approach to visualizing software architecture, breaking down complexity into manageable layers. By adopting this methodology, teams can document their systems effectively without getting lost in technical details.
🌐 The C4 Model is not just about drawing boxes and lines. It is a communication tool designed to align different audiences. Whether you are a project manager needing a high-level overview or a developer diving into specific logic, the model provides the right level of abstraction. This guide explores the four levels of the C4 Model, their specific use cases, and how to implement them effectively in your workflow.
🧩 What is the C4 Model?
The C4 Model is a hierarchical approach to software architecture documentation. It was created to solve the problem of static, overly complex diagrams that become outdated quickly. Instead of a single massive diagram, the model encourages a layered view. Each layer represents a specific level of detail, allowing readers to zoom in or out depending on their needs.
📍 The core philosophy is simplicity. It avoids unnecessary notation and focuses on the relationships between elements rather than implementation specifics. This ensures that diagrams remain relevant even as the underlying technology changes. The model consists of four distinct levels, each serving a unique purpose in the documentation process.
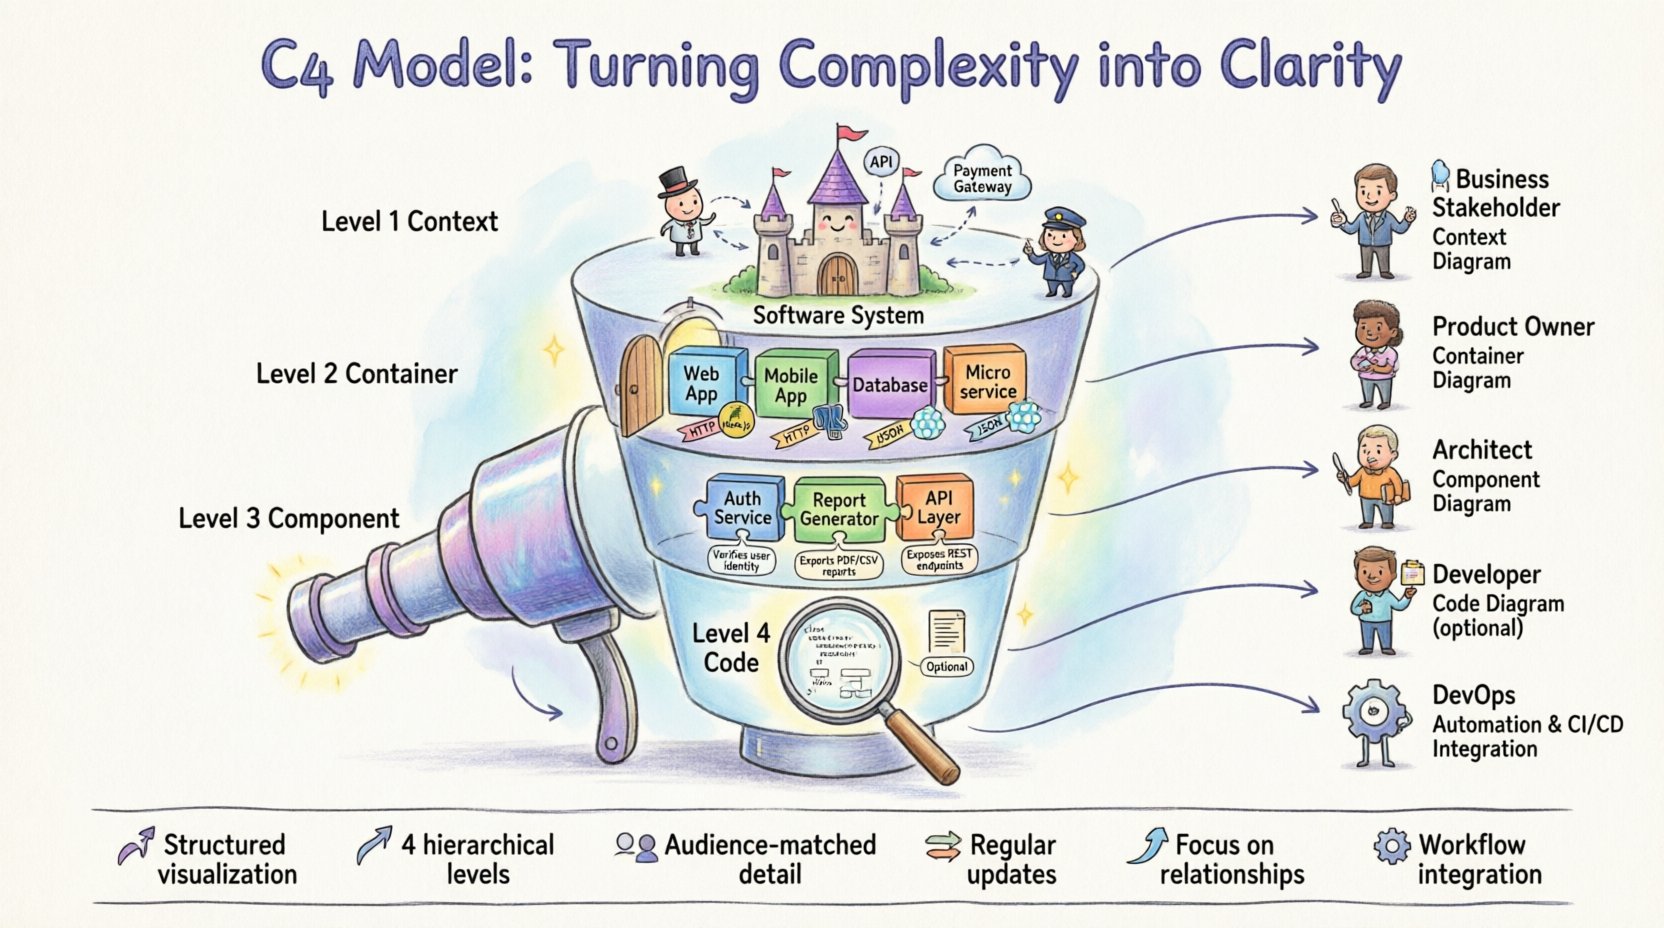
- Level 1: Context Diagram – Shows the system in its landscape.
- Level 2: Container Diagram – Describes the technology stack and data flow.
- Level 3: Component Diagram – Breaks down containers into functional blocks.
- Level 4: Code Diagram – Optional detail on specific classes or methods.
📊 Comparing the Levels
Understanding the distinction between levels is crucial. Using the wrong level for the wrong audience leads to confusion. The table below outlines the key differences between each layer.
| Level | Focus | Audience | Detail |
|---|---|---|---|
| Context | System Landscape | Stakeholders, Managers | High-level |
| Container | Technology & Boundaries | Developers, Architects | Medium-level |
| Component | Functional Logic | Developers, Engineers | Low-level |
| Code | Implementation Details | Senior Developers | Very Low-level |
🌍 Level 1: Context Diagram
The Context Diagram is the entry point for understanding a system. It answers the question: “What is this system, and who interacts with it?” This diagram places the system at the center, surrounded by the external entities that use it or provide it with data.
👥 Key Elements:
- Software System: Represented as a large circle or box in the center.
- People: Users, administrators, or external stakeholders.
- Software Systems: Other applications the system interacts with (e.g., payment gateways, third-party APIs).
- Relationships: Arrows indicating the direction of data flow.
This level is ideal for onboarding new team members or explaining the system to non-technical business partners. It avoids technical jargon and focuses on value delivery and external dependencies. A well-crafted context diagram provides immediate clarity on the scope of the project.
📦 Level 2: Container Diagram
Once the scope is defined, the Container Diagram dives deeper. It identifies the major building blocks of the system. A “container” represents a deployable unit, such as a web application, a mobile app, a database, or a microservice.
🛠️ Key Elements:
- Containers: Rectangles representing distinct technology stacks (e.g., Node.js, PostgreSQL, React).
- Technologies: Specific tools or languages used within the container.
- Connections: Protocols and data formats (e.g., HTTP, JSON, SQL) used between containers.
This diagram is vital for architects and senior developers. It helps in understanding how the system is decomposed and where data resides. It also highlights security boundaries and network communication paths. By mapping out containers, teams can identify single points of failure or unnecessary dependencies.
🧱 Level 3: Component Diagram
Inside a container, complexity remains. The Component Diagram breaks down a container into functional building blocks. A component is a logical grouping of functionality, such as a service, a module, or a library within the codebase.
🔍 Key Elements:
- Components: Circles or boxes inside a container representing specific features (e.g., “Authentication Service”, “Report Generator”).
- Responsibilities: What each component does and what it does not do.
- Interfaces: How components communicate internally.
This level is often the most used by development teams. It serves as a blueprint for implementation. It clarifies the internal structure without getting bogged down in code syntax. It helps developers understand where to place new features and how existing modules interact. It is particularly useful for large codebases where navigation can be difficult.
💻 Level 4: Code Diagram
The final level is the Code Diagram. This is optional and rarely needed for general documentation. It represents the internal structure of a component, often mapping to classes, interfaces, or methods.
⚠️ Considerations:
- Maintainability: Code changes frequently. Diagrams at this level can become outdated quickly.
- Value: Often, code comments and IDE features provide better value than static diagrams.
- Use Case: Best reserved for complex algorithms or specific architectural patterns that need explanation.
While powerful, this level requires significant effort to maintain. Teams should only adopt this if the specific complexity warrants it. In many modern agile environments, the Component Diagram is sufficient for most needs.
👥 Who Should Use Which Diagram?
Not every stakeholder needs to see every level. Matching the diagram to the audience ensures effective communication. Here is a breakdown of typical usage scenarios.
- Business Stakeholders: Prefer the Context Diagram. They care about what the system does, not how it works.
- Product Owners: Use Context and Container diagrams to understand scope and technology constraints.
- System Architects: Rely on Container and Component diagrams to design the overall structure.
- Developers: Need Component diagrams for implementation details and debugging.
- DevOps Engineers: Focus on Container diagrams to understand deployment topology and infrastructure.
📝 Best Practices for Documentation
Creating diagrams is easy; creating useful ones is hard. Adhering to specific practices ensures the documentation remains valuable over time.
1. Keep It Simple
Avoid clutter. If a diagram has too many elements, it becomes unreadable. Group related items together. Use standard shapes and colors consistently to reduce cognitive load.
2. Focus on Relationships
The value lies in the connections, not just the elements. Clearly label the data flow between systems. Explain what happens when data moves from one container to another.
3. Update Regularly
Outdated documentation is worse than no documentation. Integrate diagram updates into the development workflow. If code changes, the diagram should reflect that change.
4. Use Standard Notation
Stick to the standard C4 notation. Do not invent custom shapes or symbols that others might not recognize. Consistency aids comprehension.
5. Document the “Why”
Diagrams show the “what”. Use accompanying text to explain the “why”. Why was a specific technology chosen? Why are these two systems connected? Contextual notes add significant value.
⚠️ Common Mistakes to Avoid
Even experienced teams fall into traps when documenting architecture. Being aware of common pitfalls helps maintain high-quality documentation.
- Over-Engineering: Trying to document every single class or method. This creates noise and maintenance overhead.
- Ignoring the Audience: Showing code-level details to a manager. This confuses rather than clarifies.
- Lack of Versioning: Failing to track which version of the diagram corresponds to which release of the software.
- Static Images Only: Relying solely on static images. Interactive diagrams or linked documentation are often more useful.
- Missing Data Flows: Drawing connections without explaining the data being transferred.
⚙️ Integrating into Your Workflow
The C4 Model works best when it is part of the daily routine, not an afterthought. Here is how to integrate it effectively.
Start Small
Begin with the Context Diagram for new projects. It sets the stage and defines boundaries early. Do not attempt to create all four levels immediately.
Link to Code
If possible, link diagrams to specific repositories or documentation pages. This creates a single source of truth for the architecture.
Automate Where Possible
Use tools that can generate diagrams from code or configuration files. This reduces manual effort and keeps diagrams in sync with the actual system state.
Review During Retrospectives
Include architecture review in sprint retrospectives. Discuss whether the current diagrams reflect the current state of the system. Identify areas where documentation is lacking.
🔄 Maintenance and Versioning
Software evolves. The diagrams must evolve with it. A static diagram from a year ago is likely obsolete. Implementing a versioning strategy is essential.
- Tagging: Tag diagrams with release versions (e.g., v1.0, v2.3).
- Change Logs: Maintain a log of diagram updates alongside code change logs.
- Ownership: Assign ownership of specific diagrams to specific team members to ensure accountability.
This approach ensures that when a new developer joins the team, they can find the correct diagram for the current version of the software. It prevents confusion and reduces the risk of implementing features based on outdated knowledge.
🚀 Moving Forward
Adopting the C4 Model is a journey. It requires a shift in mindset from detailed coding to high-level thinking. The goal is clarity. By breaking down complex systems into Context, Containers, Components, and Code, teams can communicate more effectively. This shared understanding reduces errors, speeds up onboarding, and improves the overall quality of the software.
📈 Start by documenting your current system using the C4 levels. Identify the gaps. Refine the diagrams. Over time, this practice becomes second nature. The investment in clear documentation pays dividends in reduced technical debt and improved team collaboration. Clarity is not just a nice-to-have; it is a necessity for sustainable software development.
🔑 Key Takeaways
- The C4 Model provides a structured way to visualize software architecture.
- It consists of four levels: Context, Container, Component, and Code.
- Different audiences require different levels of detail.
- Diagrams must be maintained and updated regularly to remain useful.
- Focus on relationships and data flows rather than implementation details.
- Integrate documentation into the development workflow to avoid stagnation.
By following these principles, teams can turn the chaos of complex software systems into clear, actionable blueprints. The path to better architecture starts with better documentation.

