Software architecture is often compared to a complex city map. Without a clear legend or zoning plan, navigating the streets becomes a nightmare. Developers, stakeholders, and new team members often struggle to understand how different parts of an application interact. This is where the C4 Model steps in. It provides a structured approach to creating software architecture diagrams that are both meaningful and maintainable. By breaking down the system into distinct levels of abstraction, the C4 Model helps teams communicate effectively without getting lost in the weeds.
This guide explores the mechanics of the C4 Model, why it works, and how to apply it to real-world projects. We will move beyond vague descriptions and look at specific rules for each level. Whether you are designing a new microservice or documenting a legacy monolith, understanding these visualization techniques is crucial for long-term success.
🧩 The Challenge of Traditional Diagramming
Before adopting a new standard, it is helpful to understand why existing methods often fall short. In many organizations, architecture documentation suffers from two main issues:
- Over-Engineering: Diagrams attempt to show everything at once. This leads to cluttered visuals where relationships are hard to trace.
- Under-Documentation: Diagrams are too high-level, offering no insight into how data flows or where logic resides.
When a diagram is too complex, it becomes outdated quickly. Developers stop maintaining them because the effort to update the drawing does not match the value received. Conversely, if the diagram lacks detail, it fails to guide implementation. The C4 Model addresses this by enforcing a strict hierarchy of views. It forces the architect to decide which level of detail is appropriate for the audience at hand.
🏛️ Understanding the C4 Hierarchy
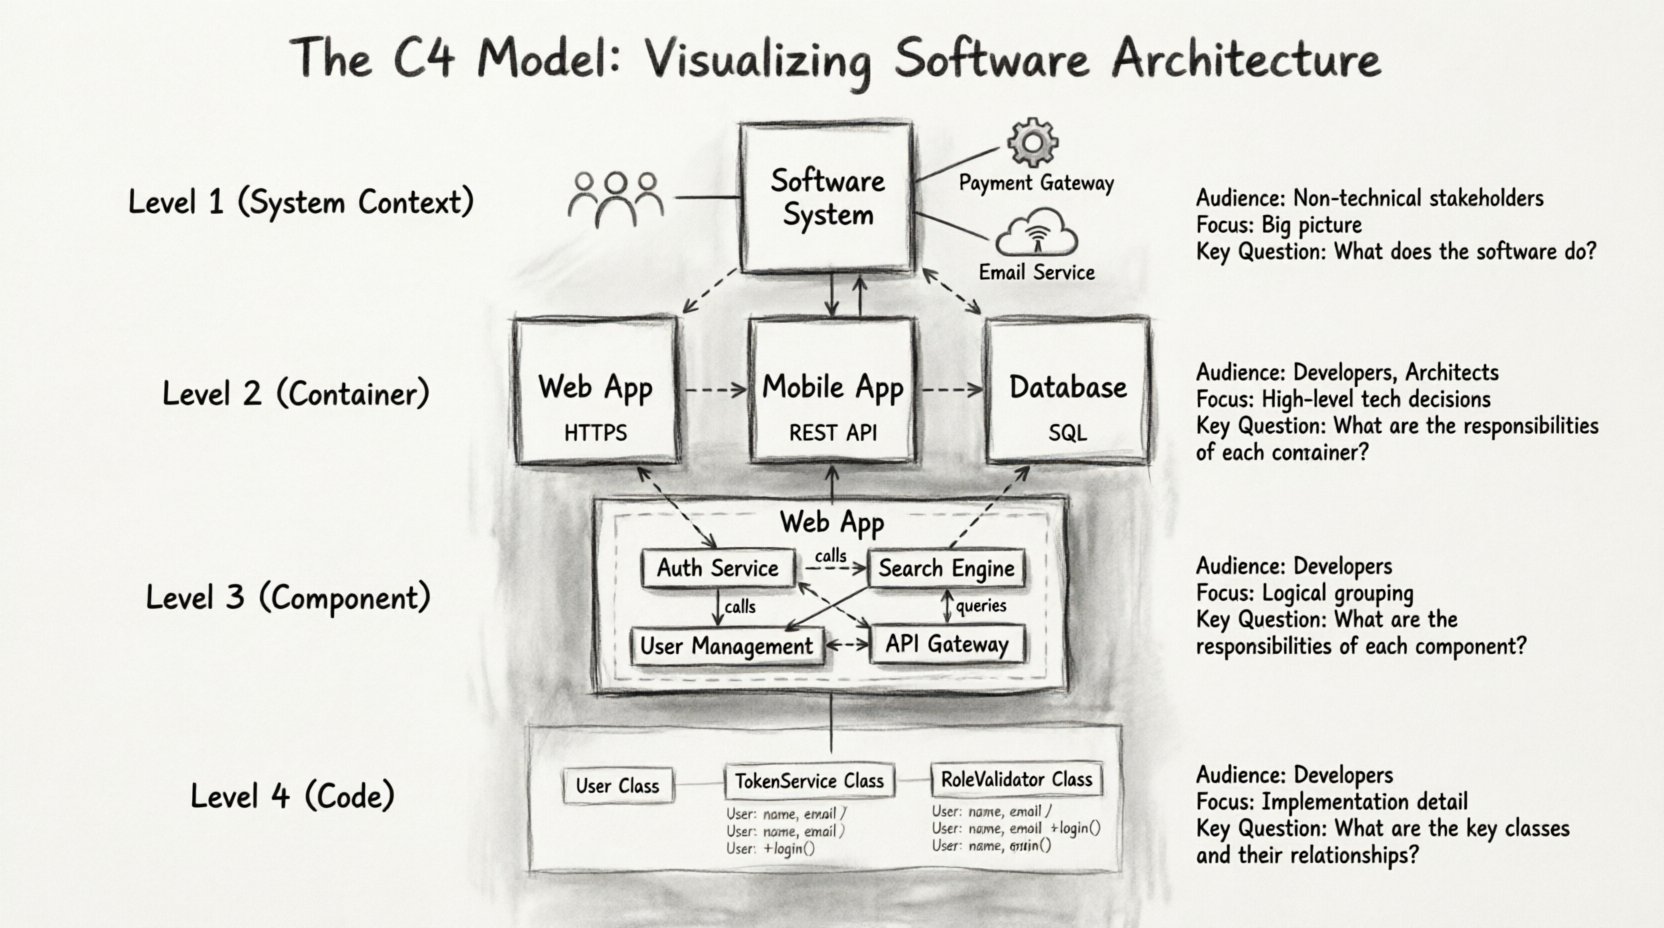
The C4 Model stands for Context, Containers, Components, and Code. It is a set of techniques and a hierarchy of diagrams that allows you to model software architecture at different levels of detail. The model is designed to answer specific questions at each level. It is not about drawing pretty pictures; it is about clarifying thinking.
Here are the four levels of abstraction defined by the model:
- Level 1: System Context Diagram – What is the system and how does it fit into the world?
- Level 2: Container Diagram – What are the major building blocks?
- Level 3: Component Diagram – How do the internal parts work together?
- Level 4: Code Diagram – How do specific classes relate?
Each level serves a specific purpose and audience. You do not need to create all four diagrams for every project. The choice depends on the complexity of the system and the needs of the stakeholders.
🌍 Level 1: The System Context Diagram
The Context Diagram is the starting point for any architectural discussion. It is the most high-level view you will create. Its primary goal is to define the boundary of your system and identify the external entities that interact with it.
🔹 Who Reads This?
This diagram is primarily for stakeholders, product managers, and new team members. It answers the question: “What does this software do?” without getting bogged down in technical implementation details.
🔹 What Goes Inside?
A context diagram contains specific types of elements. You should focus on the following:
- Software System: Your application is the central box. It should have a clear name and a brief description of its purpose.
- People: Users, administrators, or operators who interact directly with the system. Represent them with standard human icons.
- External Systems: Other software applications that your system communicates with. These are usually third-party services like payment gateways, email providers, or legacy databases.
- Connections: Lines connecting the system to people or other systems. Label these lines with the type of data or interaction (e.g., “Places Order”, “Sends Email”).
🔹 Rules for Success
- Keep it Simple: Do not include internal components here. The box representing your system is solid.
- Focus on Boundaries: Clearly show what is inside your system and what is outside. If a database is hosted externally, it is an external system.
- Limit Connections: Too many lines make the diagram unreadable. Group interactions where possible.
📦 Level 2: The Container Diagram
Once the context is established, the next step is to look inside the box. The Container Diagram breaks down the software system into high-level building blocks. In this model, a container is a distinct, deployable unit of software.
🔹 Defining a Container
A container is not a microservice or a library. It is a runtime environment. Examples include:
- A web application (e.g., a React app served via Nginx)
- A mobile application (iOS or Android)
- A database (e.g., PostgreSQL, MongoDB)
- A server-side application (e.g., a Node.js service)
- A command-line tool
🔹 Who Reads This?
This diagram is for developers and DevOps engineers. It helps the team understand the technology stack and the runtime boundaries. It answers the question: “What technology is used to build this?”
🔹 What Goes Inside?
When creating this diagram, you should visualize the architecture at a runtime level. The diagram should contain:
- Containers: Boxes representing the different technologies. Label them with the name of the technology (e.g., “PostgreSQL”, “React Application”).
- Connections: Lines showing how containers talk to each other. Use standard protocols like HTTP, TCP, or JDBC.
- People: Usually, users connect to the entry point (like the web app), but you can show administrators connecting to specific management tools.
🔹 Rules for Success
- Grouping: If you have multiple instances of the same container (like a load-balanced cluster), show one box but note the scaling.
- Technology Focus: The name of the container should imply the technology stack (e.g., “Java API”, “Angular Frontend”).
- Protocol Clarity: Specify the protocol on connection lines. This is vital for security and network configuration planning.
⚙️ Level 3: The Component Diagram
The Component Diagram dives deeper into a specific container. It reveals the internal structure of that container without showing the actual code. A component is a logical grouping of functionality within a container.
🔹 Defining a Component
Components are units of design that have a specific responsibility. They are not physical files on a disk. Instead, they represent logical modules. Examples include:
- Authentication Service
- Search Engine
- Notification Manager
- Reporting Module
🔹 Who Reads This?
This diagram is for the development team. It helps developers understand where to put their code and how to structure their modules. It answers the question: “How is the logic organized?”
🔹 What Goes Inside?
When you expand a container into a component diagram, you should see:
- Components: Boxes inside the container box. Each represents a distinct area of responsibility.
- Connections: Lines showing data flow between components. Label these with the data type or API method.
- External Dependencies: If a component calls an external service, show that connection explicitly.
🔹 Rules for Success
- Single Responsibility: Each component should do one thing well. If a component is too large, split it.
- Logical, Not Physical: Do not map components directly to folders or files. Map them to features or domains.
- Data Flow: Clearly indicate if data is read-only or if it is modified. This helps in understanding state management.
💻 Level 4: The Code Diagram
The fourth level focuses on the code itself. While the C4 Model primarily focuses on the first three levels, the Code Diagram is useful for understanding complex algorithms or class relationships within a specific component.
🔹 Who Reads This?
This is for senior developers and architects working on a specific module. It is rarely used for the whole system.
🔹 What Goes Inside?
- Classes: Specific classes within a component.
- Methods: Functions or procedures.
- Interfaces: Contracts that define how classes interact.
🔹 Rules for Success
- Use Case Specific: Only draw this when you need to explain a specific design pattern or algorithm.
- Automated Generation: It is often better to generate this from code annotations or documentation tools rather than drawing it manually.
📊 Comparing the Levels
To ensure clarity, it is helpful to compare the four levels side-by-side. This table outlines the scope, audience, and purpose of each diagram type.
| Level | Name | Focus | Audience | Key Question |
|---|---|---|---|---|
| 1 | Context | System Boundary | Stakeholders | What is the system? |
| 2 | Container | Technology Stack | Developers | What is it made of? |
| 3 | Component | Internal Logic | Developers | How does it work? |
| 4 | Code | Class Structure | Engineers | What is the implementation? |
🛠️ Best Practices for Implementation
Adopting the C4 Model requires a shift in mindset. It is not just about drawing; it is about documentation discipline. Here are some strategies to keep your architecture documentation alive and useful.
🔹 Start Small
Do not attempt to document the entire legacy system at once. Start with the Context diagram for the most critical system. Then, expand to the Container level for the most complex parts. Gradually fill in the Component details as the system evolves.
🔹 Keep It Up to Date
Outdated diagrams are worse than no diagrams. They create a false sense of security. Integrate diagram updates into your workflow. If a code change alters the architecture, the diagram should change too. Consider keeping diagrams in the same repository as the code.
🔹 Use Standard Icons
Consistency is key for readability. Use standard icons for people, databases, and cloud services. This allows anyone familiar with the model to read your diagrams instantly without needing a legend.
🔹 Label Connections
Never leave a connection line unlabelled. A line represents data. Knowing that data flows from A to B is not enough; you need to know what data flows. Is it JSON? Is it binary? Is it a query?
🚫 Common Pitfalls to Avoid
Even with a clear model, teams often make mistakes that reduce the value of the documentation. Be aware of these common traps.
- Too Much Detail: Trying to fit the entire system into one diagram defeats the purpose of abstraction. Stick to the levels.
- Ignoring the Audience: Showing a Component diagram to a product manager will confuse them. Match the diagram level to the reader’s technical depth.
- Static Documentation: Treating diagrams as one-off deliverables for a presentation. They should be living documents that evolve with the software.
- Inconsistent Naming: If a component is called “User Service” in one diagram and “Auth Module” in another, it creates confusion. Maintain a consistent glossary.
🔄 Integrating into Workflow
How do you ensure these diagrams are actually used? They must fit into the daily rhythm of the team. Here is how to integrate the C4 Model into your existing processes.
- Pull Requests: Require architecture changes to be reflected in the diagrams when significant structural changes are made.
- Onboarding: Use the Context and Container diagrams as the first step in onboarding new engineers. It gives them a mental model of the system immediately.
- Design Reviews: During technical design reviews, start with the diagram. Visualizing the plan before writing code helps catch issues early.
- Incident Response: When debugging a complex issue, a diagram can help trace the path of data quickly. It saves time compared to reading logs.
🧠 The Psychology of Visualization
Why does this model work so well? It aligns with how human brains process information. We understand systems better when they are broken down into manageable chunks. The C4 Model leverages cognitive load theory by separating concerns.
When you look at a Context diagram, you do not need to worry about database schemas. When you look at a Component diagram, you do not need to worry about network topology. This separation allows the brain to focus on the specific problem at hand. It reduces cognitive friction and allows for faster decision-making.
🚀 Moving Forward
Adopting the C4 Model is a journey. It takes time to create the initial diagrams and maintain them. However, the return on investment is significant. Teams that visualize their architecture effectively spend less time arguing about design decisions and more time building features.
Start by drawing the Context diagram for your current project. Identify the people and external systems. Then, expand inward. As you refine your diagrams, you will find that the complexity of your system becomes manageable. The C4 Model provides the structure needed to tame complexity.
Remember, the goal is not perfection. The goal is clarity. A simple, clear diagram is infinitely more valuable than a perfect, unreadable one. Use the levels to guide your audience. Use the rules to guide your drawing. And always keep the audience in mind.
By following these principles, you can create documentation that serves as a reliable source of truth. This reduces the risk of knowledge silos and ensures that the architecture remains understandable as the team grows. The C4 Model is a tool for communication, and like any tool, its value depends on how well it is used.

