Software architecture is often described as the blueprint of a digital product. Yet, in the fast-paced world of development, these blueprints frequently become outdated, misunderstood, or lost entirely. Effective communication regarding system design is not just a nice-to-have; it is a critical requirement for scalability and maintainability. This is where the C4 Model steps in. It provides a standardized approach to creating software architecture diagrams that serve both high-level stakeholders and deep-dive developers.
Industry leaders across finance, healthcare, and technology have adopted this methodology to bridge the gap between business requirements and technical implementation. This guide explores how organizations have leveraged the C4 Model to improve clarity, reduce onboarding time, and accelerate delivery pipelines. We will examine specific scenarios where architectural documentation made the difference between a stalled project and a successful launch.
🧩 Understanding the C4 Model Hierarchy
Before diving into the success stories, it is essential to understand the framework that enables them. The C4 Model is structured around four levels of abstraction. Each level serves a specific audience and answers a distinct question about the system.
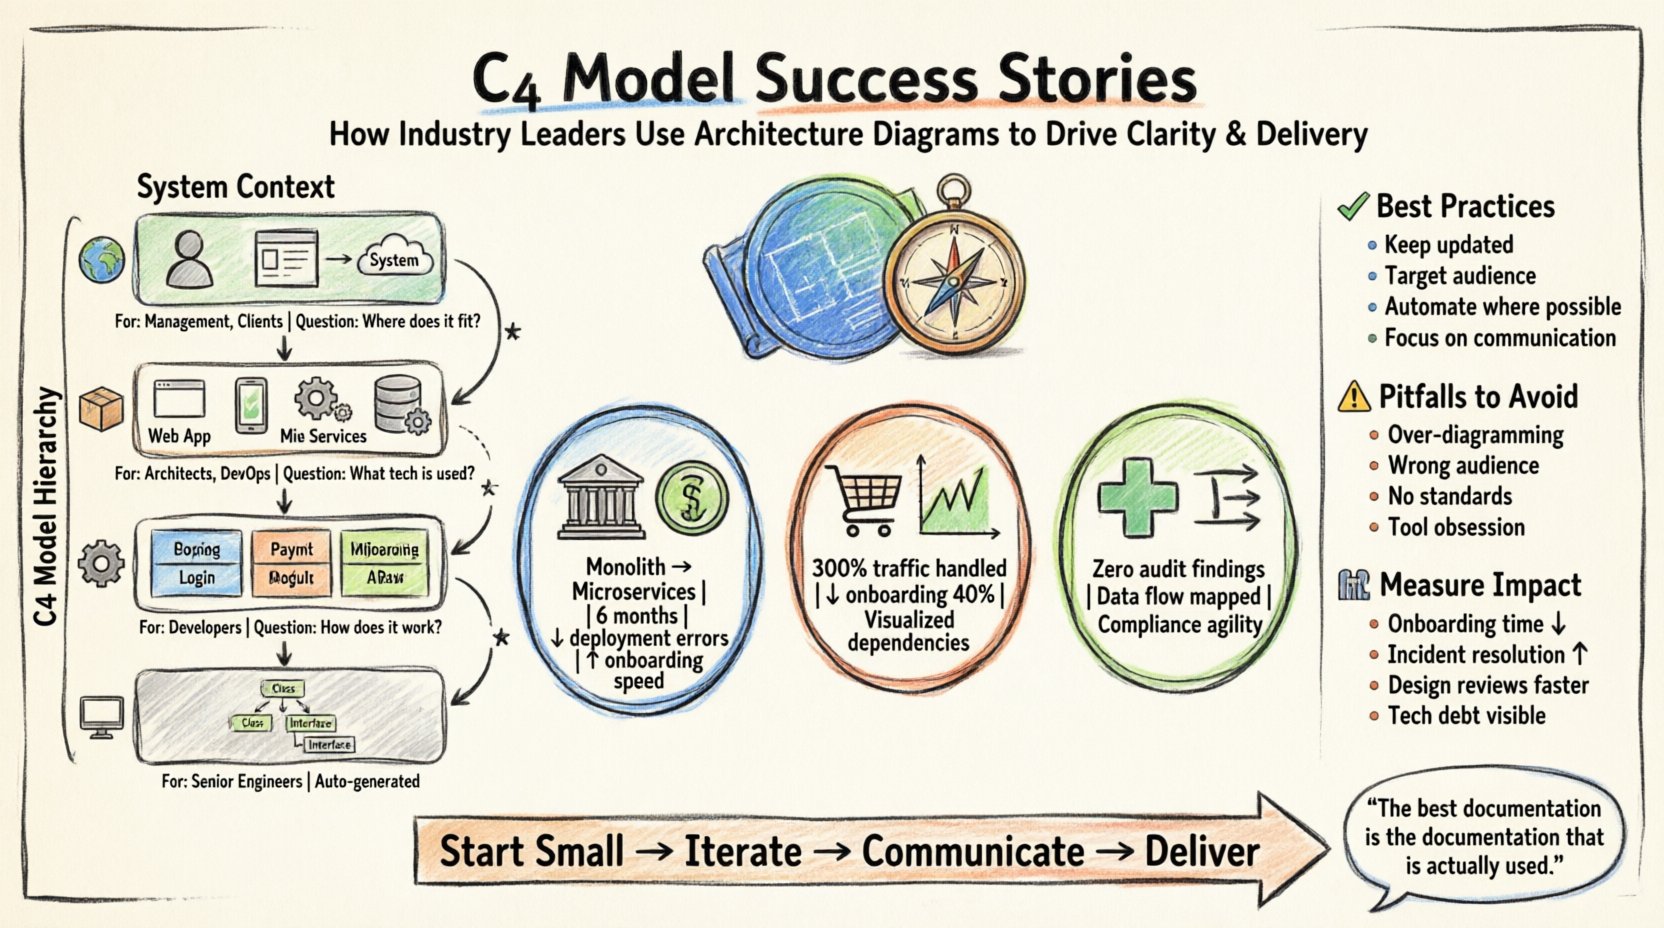
- Level 1: System Context Diagram 🌍
What is the system, who uses it, and what does it talk to? This view is designed for non-technical stakeholders and product managers. It shows the system as a single box and identifies the people and other systems interacting with it. - Level 2: Container Diagram 📦
What are the major building blocks? This view breaks the system down into containers, such as web applications, mobile apps, microservices, or databases. It highlights the technology stack and communication protocols between these containers. - Level 3: Component Diagram ⚙️
How is each container built? This view zooms into a specific container to show the high-level components inside. It focuses on functionality rather than code structure, making it useful for developers and architects. - Level 4: Code Diagram 💻
What does the code look like? This view maps components to classes and interfaces. While detailed, this level is often generated automatically and is less commonly maintained manually due to the rapid pace of code changes.
Many organizations find that Levels 1, 2, and 3 provide the most value. Level 4 is typically reserved for specific debugging scenarios or automated documentation generation.
📊 Comparison of Diagram Levels
| Level | Audience | Focus | Key Question |
|---|---|---|---|
| System Context | Management, Clients | Boundaries & Integration | Where does the system fit? |
| Container | Architects, DevOps | Technology & Deployment | What tech is used? |
| Component | Developers | Functionality & Logic | How does it work? |
| Code | Senior Engineers | Implementation Details | What classes exist? |
🏦 Success Story: Modernizing a Legacy Banking System
One of the most challenging environments for architectural documentation is the financial sector. A major financial institution faced a critical hurdle: they needed to migrate a monolithic banking application to a microservices architecture. The legacy codebase was poorly documented, and the original architects had left the organization years ago.
📉 The Challenge
The development team struggled to understand the dependencies between different modules. When a change was proposed, it was impossible to predict the ripple effect. This led to frequent deployment failures and a lack of confidence in the system’s stability. The team spent weeks mapping relationships manually on whiteboards, which quickly became obsolete.
🚀 The C4 Intervention
The leadership team mandated the adoption of the C4 Model for all migration planning. The process involved the following steps:
- Mapping the System Context: Architects started by documenting the external systems the banking platform interacted with, such as payment gateways, credit bureaus, and customer portals. This provided a clear boundary for the migration.
- Defining Containers: The monolith was decomposed into logical containers. Each container was assigned a specific responsibility, such as “User Management” or “Transaction Processing”. Technology choices were explicitly noted.
- Refining Components: For the most critical containers, component diagrams were created to identify high-risk areas. This allowed the team to prioritize refactoring efforts based on complexity and coupling.
📈 The Outcome
Within six months, the organization reported a significant reduction in deployment errors. Because the architecture was visualized clearly, new developers could understand the system in days rather than months. The documentation also served as a communication tool during audits, providing regulators with a clear view of data flow and security boundaries. The migration was completed ahead of schedule, largely because the architectural risks were identified early.
🛒 Success Story: Scaling an E-Commerce Platform
A global retail company experienced rapid growth during peak shopping seasons. Their infrastructure was struggling to handle the load, and the architecture had become a tangled web of ad-hoc integrations. The engineering leadership realized they needed a standardized way to communicate technical debt and scaling plans to the board.
📉 The Challenge
The primary issue was visibility. When the sales team requested new features, the engineering team could not easily explain which systems would be impacted. This resulted in scope creep and unexpected technical debt. Furthermore, the onboarding process for new hires was slow, as they had to dig through code repositories to understand the system topology.
🚀 The C4 Intervention
The engineering team introduced the C4 Model as the standard for all design proposals. The approach focused heavily on the Container and Component levels.
- Visualizing Dependencies: By creating container diagrams, the team identified tight coupling between the inventory service and the pricing service. This visibility allowed them to decouple these services before scaling.
- Standardizing Protocols: The diagrams forced the team to document the communication protocols used between containers. This revealed inconsistencies where some services used synchronous calls while others used asynchronous queues.
- Documentation as Code: The diagrams were versioned alongside the codebase. Whenever a service was updated, the diagram was updated as part of the pull request process.
📈 The Outcome
The platform successfully handled a 300% increase in traffic during the holiday season without major incidents. The clarity provided by the diagrams allowed the team to optimize database queries and caching strategies more effectively. Additionally, the onboarding time for new engineers dropped by 40%. The board was able to approve infrastructure budget increases based on the clear visual evidence of scaling needs presented in the system context diagrams.
🏥 Success Story: Ensuring Compliance in Healthcare
In the healthcare sector, data privacy and regulatory compliance are paramount. A health technology provider needed to integrate patient data from multiple hospitals while ensuring strict adherence to data protection regulations. The complexity of data flows made it difficult to prove compliance during external audits.
📉 The Challenge
The system involved complex data pipelines moving sensitive information across different cloud environments. Auditors required detailed evidence of how data was encrypted, where it was stored, and who had access. Manual documentation was insufficient because it was often out of date by the time the audit occurred. The risk of non-compliance threatened the company’s ability to operate.
🚀 The C4 Intervention
The security and architecture teams collaborated to use the C4 Model to map data flows explicitly. The focus was on the System Context and Container levels to satisfy regulatory requirements.
- Mapping Data Boundaries: The system context diagram clearly showed which external entities accessed patient data. This helped identify third-party vendors that required strict contractual agreements.
- Highlighting Security Controls: In the container diagrams, security controls such as encryption at rest and in transit were annotated directly on the diagram. This made it easy for auditors to verify that every container met security standards.
- Traceability: The diagrams provided a traceable link from the business requirement to the technical implementation. If a regulation changed, the team could quickly identify which containers were affected.
📈 The Outcome
The organization passed their annual compliance audit with zero findings. The visual documentation served as a living record of the security posture. When a new regulation was introduced, the team could update the diagrams and assess the impact within a week. This agility reduced the cost of compliance significantly and built trust with hospital partners who were concerned about data security.
🛠 Best Practices for Implementation
While the success stories above highlight the potential of the C4 Model, implementation requires discipline. Adopting a new documentation standard can feel like overhead if not managed correctly. Here are key practices observed by successful teams.
📌 Keep it Updated
Documentation is only valuable if it reflects reality. Teams that treated diagrams as static artifacts found them becoming obsolete quickly. Successful teams integrated diagram updates into their definition of done. If a container was added or a dependency changed, the diagram was updated in the same commit.
📌 Target the Right Audience
Not every diagram needs to be seen by everyone. The System Context Diagram should be shared with product owners. The Component Diagram should be shared with developers. Avoid cluttering high-level views with low-level details. This ensures that each stakeholder gets the information they need without being overwhelmed.
📌 Automate Where Possible
Manual drawing of diagrams is prone to error. Many organizations use tools that can generate diagrams from code repositories or configuration files. This reduces the maintenance burden and ensures that the code and the documentation remain in sync. However, manual refinement is still necessary to add context that code cannot express.
📌 Focus on Communication
The goal is not to create pretty pictures. The goal is to facilitate conversation. Use diagrams in design meetings to discuss trade-offs. Use them in incident reviews to understand how a failure propagated. If a diagram does not spark a discussion, it may need to be simplified or refocused.
🚫 Common Pitfalls to Avoid
Even with the best intentions, teams can stumble during adoption. Understanding these common pitfalls can save time and frustration.
- Over-Diagramming: Creating diagrams for every single minor change leads to maintenance fatigue. Focus on the architecture, not every function.
- Ignoring the Audience: Creating complex component diagrams for non-technical stakeholders leads to confusion. Tailor the level of detail to the reader.
- Lack of Standards: Without consistent naming conventions, diagrams become a source of confusion. Agree on how to name containers, components, and relationships before starting.
- Tool Dependency: Focusing too much on the features of the drawing tool rather than the content of the diagram. The value lies in the model, not the software used to create it.
📊 Measuring the Impact
How do you know if the C4 Model is working for your organization? Look for these key performance indicators.
- Onboarding Time: Track how long it takes for a new engineer to make their first production commit. A reduction indicates better documentation.
- Incident Resolution Time: When systems fail, can the team identify the root cause faster? Clear architecture diagrams help isolate issues quickly.
- Design Review Efficiency: Do design reviews take less time? If the architecture is clear, the team can focus on trade-offs rather than clarifying basic connectivity.
- Technical Debt Reduction: Are teams able to identify and refactor high-risk areas more frequently? Visibility leads to action.
🔮 Looking Ahead
The software landscape continues to evolve with the rise of serverless computing, edge computing, and complex distributed systems. As systems become more dynamic, the need for clear, maintainable architecture documentation becomes even more critical. The C4 Model offers a flexible foundation that can adapt to these changes.
By focusing on the four levels of abstraction, organizations can maintain a balance between high-level strategy and low-level implementation. The success stories from industry leaders demonstrate that this is not just a theoretical exercise. It is a practical tool that drives efficiency, reduces risk, and fosters a culture of clarity.
For teams considering adoption, the recommendation is to start small. Pick one project and create a System Context and Container diagram. Involve the team in the process. Gather feedback. Iterate. The journey toward better architectural communication is ongoing, but the destination is a more resilient and understandable software ecosystem.
Remember, the best documentation is the documentation that is actually used. If your diagrams are sitting in a folder and nobody looks at them, they are not serving their purpose. Integrate them into your daily workflow. Make them part of the conversation. That is where the true value lies.
As you move forward with your own architectural documentation, keep the audience in mind. Keep the diagrams simple. And keep them updated. These principles, combined with the structured approach of the C4 Model, provide a robust path toward successful software delivery.

