Software architecture documentation often suffers from a critical issue: inconsistency. Teams create diagrams that live in different formats, serve different audiences, and become outdated the moment they are saved. This fragmentation leads to confusion, slows down onboarding, and creates knowledge silos. The C4 Model addresses this problem by providing a structured approach to visualizing software architecture. It acts as a standardized language for describing systems, ensuring that every stakeholder—from developers to business managers—understands the design clearly. 📝
When teams adopt the C4 Model, they stop guessing about what to document and start focusing on what matters. This guide explores how the model functions, why it is essential for modern development, and how to implement it effectively without relying on specific tools or vendors. By following this framework, organizations can maintain clarity and control over their technical assets. 🚀
Understanding the C4 Model 🧩
The C4 Model is a hierarchical approach to software architecture documentation. It breaks down complex systems into four distinct levels of abstraction. Each level serves a specific purpose and targets a specific audience. This separation ensures that diagrams remain readable and relevant. Instead of one massive diagram that nobody understands, you get a series of focused views.
The core philosophy is simple: start high and go deep. You begin with the big picture and zoom in only when necessary. This prevents cognitive overload. It allows architects to communicate the structure of a system without getting lost in implementation details immediately. The model was designed to be tool-agnostic, meaning it focuses on the content of the diagrams rather than the software used to create them. 🛠️
Why Standardization Matters 📏
Without a standard, every developer draws diagrams differently. Some use boxes for everything. Others use circles. Some label relationships as “calls” while others say “uses”. This lack of uniformity makes it difficult to review designs or onboard new team members. The C4 Model provides a consistent vocabulary and notation.
- Consistency: Everyone uses the same shapes and colors for the same types of elements.
- Scalability: The model works for small scripts and massive microservices architectures alike.
- Maintainability: It is easier to keep documentation up to date when the structure is predictable.
- Communication: Stakeholders can discuss architecture without needing to learn a new diagramming language.
The Four Levels of Abstraction 📊
The heart of the C4 Model lies in its four levels. Each level provides a different perspective on the system. Moving between these levels allows you to tailor the information to the person reading the diagram. Below is a breakdown of each level and its specific focus.
1. System Context Diagram 🌍
The System Context diagram is the highest level. It shows the software system as a single box and places it in the broader environment. This view answers the question: “What is this system, and who interacts with it?”
- Primary Audience: Business stakeholders, project managers, and new developers.
- Focus: External users, external systems, and the software system itself.
- Key Elements: People, other software systems, and data flows between them.
In this diagram, the software system is a single box. You do not show internal components or containers. You only show the boundaries. This keeps the diagram simple. It prevents the reader from getting distracted by technical details before they understand the system’s purpose. The arrows between elements indicate data flow. They show direction and the type of information being exchanged, such as “User Data” or “Configuration Settings”.
2. Container Diagram 📦
Once the context is established, you zoom in. The Container diagram breaks the system box into its major building blocks. A container is a high-level building block of code. It represents a runtime environment. Examples include a web application, a mobile app, a database, or a microservice. 🖥️
- Primary Audience: Developers, system administrators, and DevOps engineers.
- Focus: The technology stack and boundaries of the system.
- Key Elements: Containers, technology types, and communication protocols.
This diagram explains how the system is built. It shows the separation of concerns. For instance, you might see a web server container talking to a database container. You also see the protocols used, such as HTTP, TCP/IP, or SQL. This level is crucial for understanding infrastructure requirements. It helps teams decide which technologies to use and how they interact. It does not, however, show the code inside the containers yet.
3. Component Diagram ⚙️
The Component diagram goes deeper. It shows the high-level logical building blocks inside a specific container. A component represents a cohesive piece of functionality. It could be a service, a module, or a library. This level is about logic, not physical deployment. 🧠
- Primary Audience: Software developers and architects.
- Focus: Internal structure and responsibilities of a container.
- Key Elements: Components, interfaces, and internal data flows.
Here, you break down a single container from the previous level. You show how the code is organized. You might see a “User Management” component talking to a “Payment Processing” component. The relationships show dependencies. This helps developers understand where to write new code and how to avoid breaking existing functionality. It serves as a blueprint for implementation.
4. Code Diagram 💻
The Code diagram is the lowest level. It shows the class or method structure within a component. This level is often optional. It is used when the logic is complex and requires deep understanding. For most projects, the Component diagram is sufficient. 📂
- Primary Audience: Senior developers and code reviewers.
- Focus: Implementation details and class relationships.
- Key Elements: Classes, methods, attributes, and inheritance.
While the C4 Model includes this level, many teams skip it. Detailed class diagrams can become outdated quickly as code refactors. If you need this level, ensure you have a process to keep it synchronized with the code. Otherwise, it becomes a burden rather than a help.
Comparison of Diagram Levels 🔍
To clarify the differences between the levels, consider the following comparison table. This table highlights the scope, audience, and content for each diagram type.
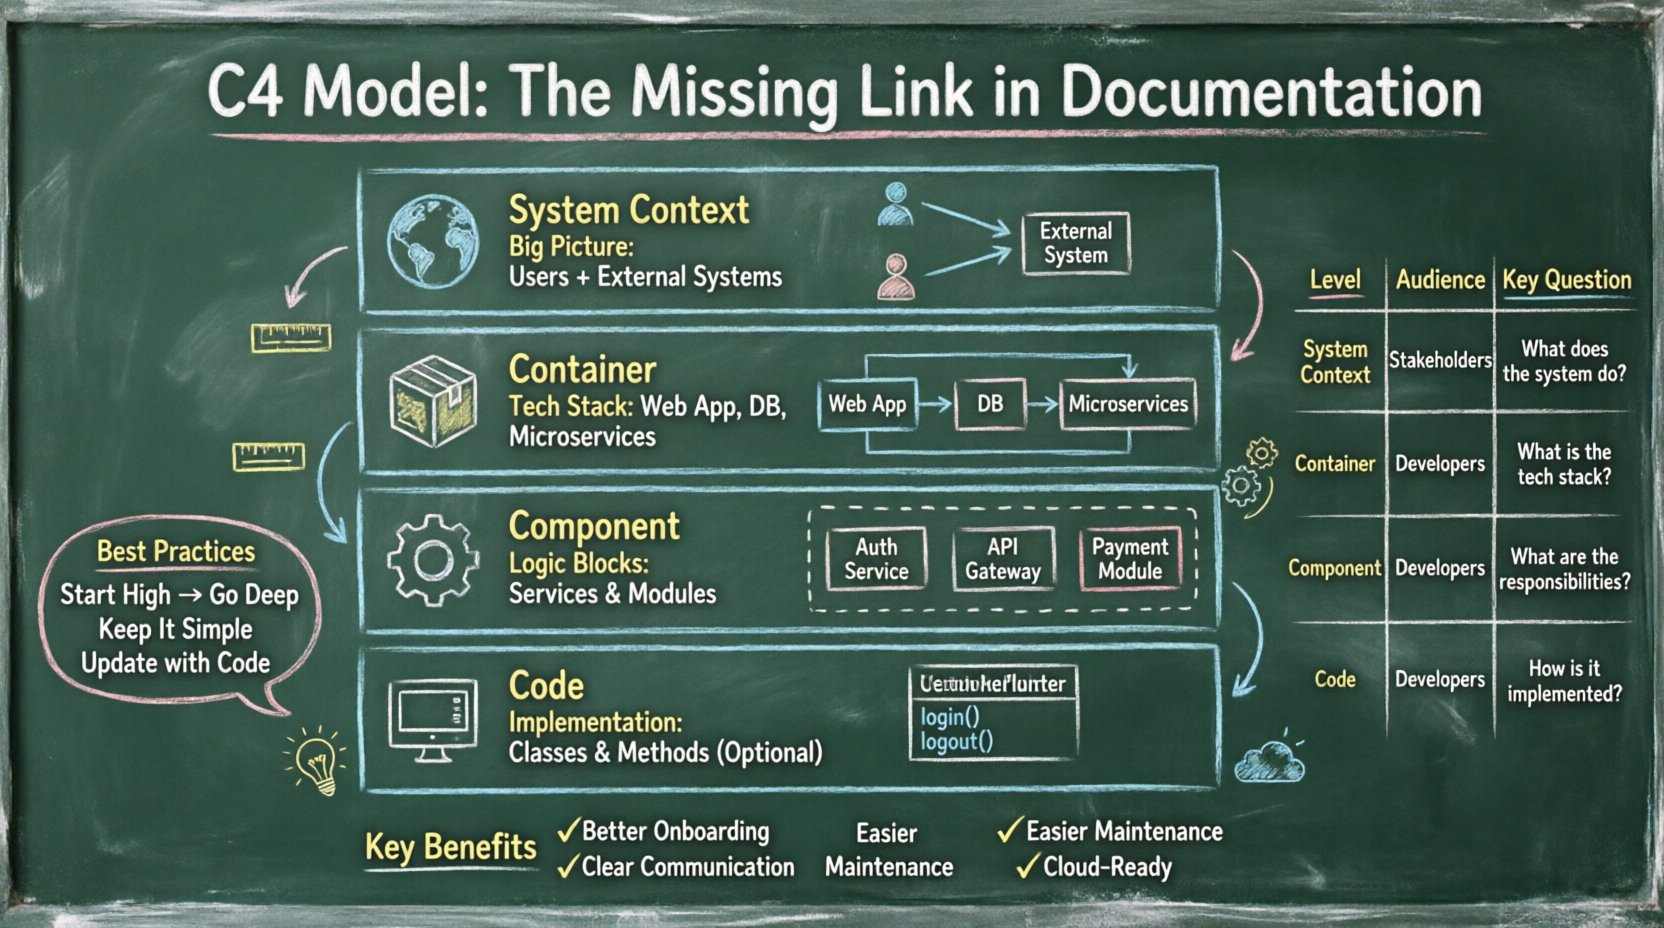
| Level | Scope | Audience | Key Question Answered |
|---|---|---|---|
| System Context | Entire System | Stakeholders, Managers | What is the system and who uses it? |
| Container | System Boundaries | Developers, Ops | How is the system built? |
| Component | Inside a Container | Developers | What are the internal functions? |
| Code | Inside a Component | Senior Developers | How is the logic implemented? |
Benefits of Adopting the C4 Model ✅
Implementing this model brings tangible improvements to the software development lifecycle. It is not just about drawing pictures; it is about improving the quality of the software and the team’s efficiency. Here are the primary advantages.
Better Onboarding Experience 🎓
New hires often struggle to understand legacy systems. They ask questions that should have been answered by documentation. With the C4 Model, you provide a clear path from high-level context to specific logic. A new developer can start with the System Context diagram to understand the business value, then move to Containers to see the tech stack, and finally look at Components to understand the code structure. This reduces the time it takes for a new member to become productive.
Improved Communication Across Teams 🤝
When developers, testers, and product managers use the same diagrams, misunderstandings decrease. Everyone speaks the same language. If a product manager asks about a feature, you can point to the Component diagram and show exactly which logical block handles it. If an infrastructure engineer needs to know about dependencies, the Container diagram provides the answer. This shared understanding reduces friction and meetings.
Facilitates Refactoring and Maintenance 🛠️
As systems evolve, documentation often becomes stale. The C4 Model encourages documentation that is tied to the structure of the system. When you refactor code, you update the relevant diagram level. Because the levels are distinct, you do not need to redraw the entire system map when you change a single component. This modularity makes documentation maintenance feasible. It becomes part of the workflow rather than a separate task.
Supports Microservices and Cloud Architectures ☁️
Modern architectures are distributed. Microservices add complexity because there are many moving parts. The Container diagram is particularly useful here. It helps visualize how different services communicate. It highlights boundaries and protocols. This clarity is essential for managing distributed systems. Without it, teams often lose track of service dependencies, leading to outages and integration issues.
Best Practices for Implementation 🛡️
Adopting the C4 Model requires discipline. It is easy to fall into the trap of over-documenting or under-documenting. Follow these practices to ensure success.
Start with the Context 🎯
Never start with the code. Start with the System Context diagram. This ensures you understand the business problem before you solve it. If you cannot define the context, the internal structure does not matter. Get agreement on the context diagram before moving to containers. This aligns the team on the scope of the project.
Keep Diagrams Simple ✨
Avoid clutter. If a diagram has too many elements, split it. Do not try to show everything in one view. The System Context diagram should have one system box. The Container diagram should focus on the specific system, not the whole enterprise. Simplicity aids comprehension. Use labels to explain flows. Do not rely on visual complexity to convey meaning.
Automate Where Possible ⚙️
Manual maintenance is a recipe for stale documentation. If you have a way to generate diagrams from code or configuration, use it. This ensures the diagrams stay accurate. Many tools allow you to define the structure in text and render the visuals. This reduces the overhead of drawing boxes and arrows manually. It keeps the documentation source of truth aligned with the code.
Review Regularly 🔄
Documentation is not a one-time task. Schedule reviews during sprint planning or architecture decision meetings. Ask the team: “Is this diagram accurate?” If the answer is no, update it. Make documentation part of the Definition of Done. A feature is not complete until the relevant diagrams are updated.
Common Pitfalls to Avoid ⚠️
Even with a good framework, teams can make mistakes. Being aware of these common errors helps you avoid them.
- Too Much Detail: Putting code-level details in a Container diagram confuses the audience. Stick to the right level of abstraction for each diagram.
- Ignoring the Audience: Showing a Component diagram to a business stakeholder is not helpful. They need the System Context. Tailor the view to the reader.
- Static Documentation: Treating diagrams as final artifacts. They must evolve with the system. If the code changes, the diagram must change.
- Using Specific Tools: Focusing on how to draw the box rather than what the box represents. The model is tool-agnostic. Focus on the meaning, not the software used to create it.
- Lack of Version Control: Keeping diagrams in a shared folder without tracking changes. Use version control for your documentation files just like you do for code.
Strategies for Maintenance 📅
Maintaining documentation is often the hardest part. It requires effort and time. To make it sustainable, integrate it into the development process. Do not treat it as a separate phase.
Link to Code Repositories 🔗
Store diagrams in the same repository as the code. This makes them easy to find and update. It also allows for code review processes to catch documentation errors. If a pull request changes the architecture, the review should check if the diagram needs updating.
Use Text-Based Definitions 📄
Consider using text-based definitions for your diagrams. This allows you to version control the structure easily. You can diff changes to see what was added or removed. This is more robust than binary image files. It ensures that the diagram definition is always in sync with the codebase.
Encourage Peer Reviews 👀
Have team members review each other’s diagrams. This acts as a quality check. It also spreads knowledge. If one person draws the diagram, another person understands the system better. This cross-pollination reduces dependency on single individuals.
Conclusion on Architecture Documentation 🏁
Documentation is not a luxury; it is a necessity for sustainable software development. The C4 Model provides a proven framework to make this documentation effective. It bridges the gap between business needs and technical implementation. By using this model, teams can create clear, consistent, and maintainable views of their architecture.
Adopting this approach takes time and discipline. However, the long-term benefits outweigh the initial effort. You gain clarity, improve communication, and reduce the risk of technical debt. Start with the System Context diagram and work your way down. Keep it simple. Keep it updated. And ensure every stakeholder has the information they need to succeed. 🌟
Remember, the goal is not to create perfect diagrams. The goal is to create diagrams that help people understand the system. When your documentation serves that purpose, you have succeeded. 🛠️

