Software systems are becoming increasingly complex. As applications grow, the challenge of visualizing their structure becomes critical for development teams. The C4 Model provides a standardized approach to creating software architecture diagrams. This method focuses on abstraction levels that match the audience’s needs. It moves away from overly detailed technical drawings toward clear, meaningful representations.
Architecture diagrams serve as a communication tool. They help stakeholders understand how a system works without getting lost in code implementation details. By using the C4 Model, teams can maintain consistency across documentation. This consistency ensures that anyone joining the project can quickly grasp the system’s high-level design.
🧩 Understanding the C4 Model Structure
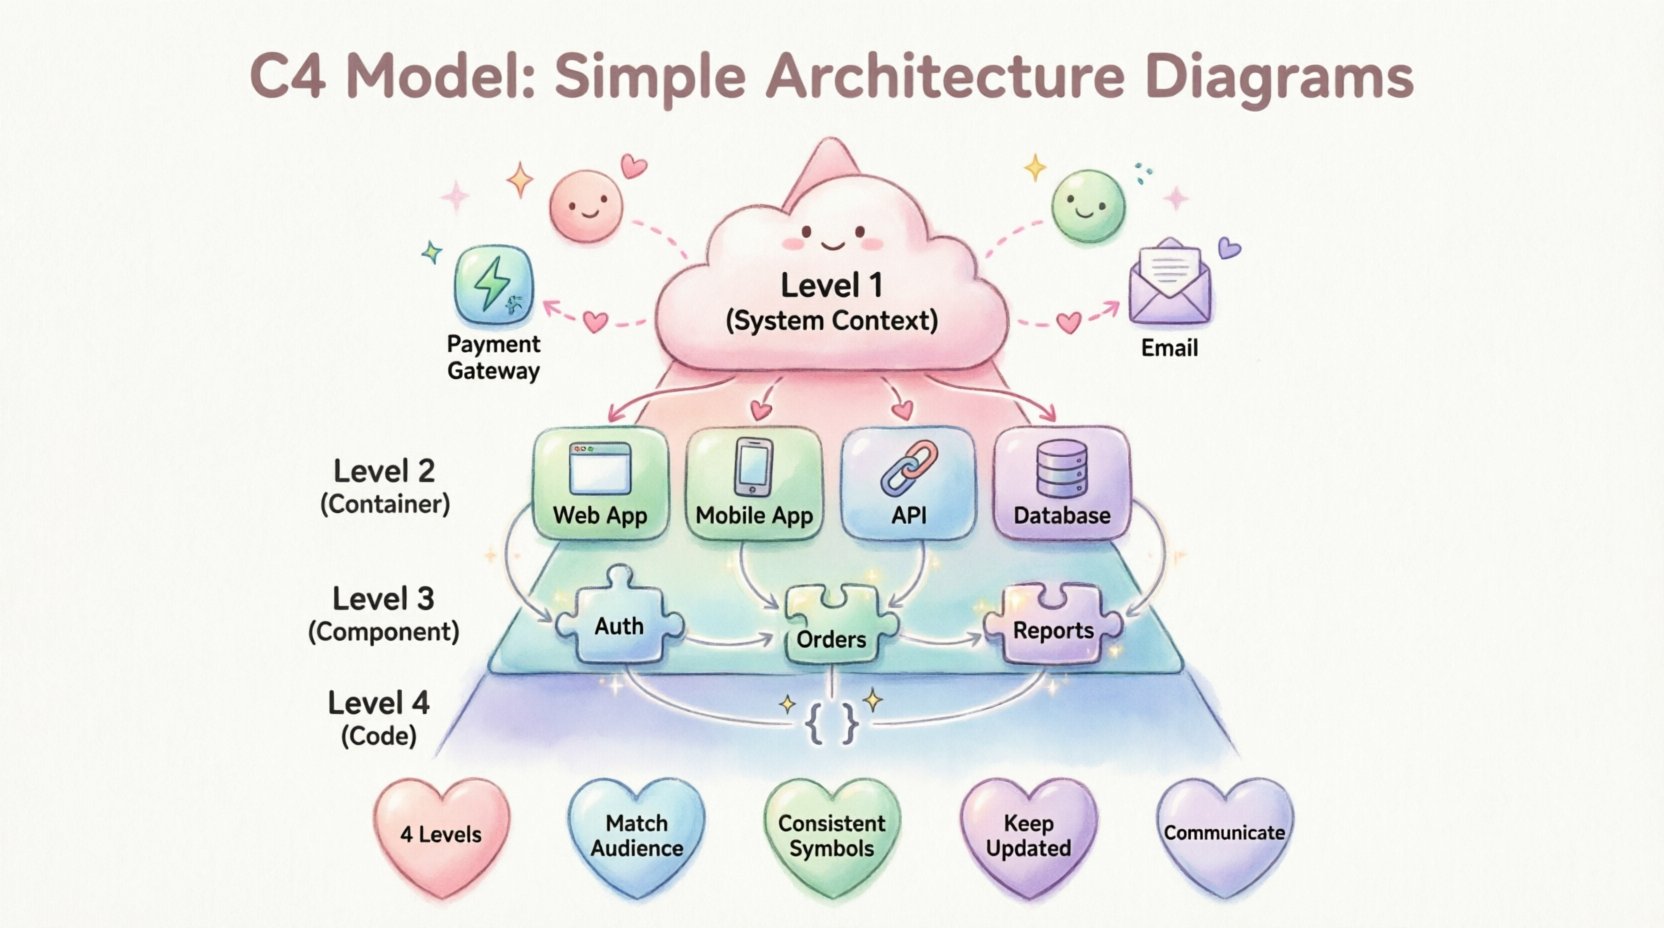
The C4 Model defines four distinct levels of abstraction. Each level answers a specific question about the system. Moving from the highest level of abstraction to the lowest, the diagrams provide increasing detail. This hierarchy allows developers to zoom in only when necessary.
- Level 1: System Context – What is the system, and who uses it?
- Level 2: Container – What are the high-level building blocks?
- Level 3: Component – How do the internal pieces work together?
- Level 4: Code – What are the specific classes or functions?
Not every project requires all four levels. Many systems are well understood with just the first three. The fourth level is typically reserved for complex algorithms or specific domain logic that needs deep explanation.
🌍 Level 1: System Context Diagrams
The System Context diagram sits at the top of the hierarchy. It provides a bird’s-eye view of the entire software system. This diagram answers the question: What is this system, and how does it fit into the wider world?
Key Elements
- The System Itself: Represented as a single box in the center. This is the boundary of your application.
- Users: People or roles that interact with the system. This includes administrators, customers, and external staff.
- External Systems: Other software applications that communicate with your system. Examples include payment gateways, email services, or legacy databases.
- Relationships: Lines connecting the system to users and external systems. These lines often carry labels describing the data flow, such as “Sends Invoice” or “Retrieves User Data”.
This level is crucial for onboarding new team members. It sets the boundaries of responsibility. It clarifies what the system does and, just as importantly, what it does not do. External dependencies are visible here, which helps in risk assessment and planning.
📦 Level 2: Container Diagrams
Once the context is established, the next step is to break down the system. The Container diagram explores the internal structure at a high level. A container represents a distinct runtime environment. It is where the application code actually executes.
Defining Containers
A container is not a microservice or a virtual machine in the infrastructure sense. Instead, it is a logical unit of deployment. Common examples include:
- Web Applications: A single-page application running in a browser.
- Mobile Applications: Native apps for iOS or Android.
- APIs: RESTful or GraphQL services that expose functionality.
- Database Systems: SQL or NoSQL stores that hold persistent data.
- Batch Processes: Scheduled jobs that run background tasks.
Interactions
The diagram shows how these containers communicate with each other. This includes protocols and data formats. For instance, a web application might communicate with an API server using HTTP/HTTPS. The API server might query a database using a specific driver language.
Visualizing these connections helps identify bottlenecks. It highlights security boundaries. If a container handles sensitive data, its connections must be secure. This level is often the most used in daily development discussions.
⚙️ Level 3: Component Diagrams
Inside each container, there are components. A component is a logical grouping of code. It represents a set of functionality that is cohesive. Unlike containers, components do not run independently. They exist within the runtime of the container.
Identifying Components
Components are defined by their purpose. They should follow the single responsibility principle. Examples of components include:
- Authentication Service: Handles login and user verification.
- Order Processing: Manages the logic for creating and fulfilling orders.
- Reporting Engine: Generates analytics and PDF documents.
- Caching Layer: Stores frequently accessed data to improve performance.
Connections and Dependencies
The diagram maps the relationships between components. It shows data flow and control flow. It is important to distinguish between synchronous and asynchronous communication. Synchronous calls happen in real-time, while asynchronous events happen in the background.
This level is vital for developers working on specific features. It allows them to see how their code fits into the larger picture of the container. It prevents code duplication by showing existing functionality that could be reused.
💻 Level 4: Code Diagrams
The final level dives into the implementation details. This level is rarely drawn manually. It is often generated from the code itself using automated tools. It shows classes, interfaces, and methods.
When to Use
Code diagrams are useful when explaining complex algorithms. They are also helpful for legacy system documentation. However, they can become outdated quickly if not maintained. Changes in code are frequent, making manual updates to code diagrams difficult.
Limitations
- Maintainability: High effort to keep current.
- Readability: Can become cluttered with too many details.
- Abstraction: Loses the high-level business context.
Most teams skip this level unless there is a specific need to document intricate logic.
📊 Comparing the Levels
Understanding when to use each level is essential for effective documentation. The following table summarizes the differences between the four levels.
| Level | Focus | Audience | Detail |
|---|---|---|---|
| Level 1 | System Context | Stakeholders, Managers | High |
| Level 2 | Containers | Developers, Architects | Medium |
| Level 3 | Components | Developers, QA Engineers | Low |
| Level 4 | Code | Senior Developers | Very Low |
🛠️ Best Practices for Diagramming
Creating effective diagrams requires discipline. It is easy to add too much information. The goal is clarity, not completeness. Here are guidelines to ensure your diagrams remain useful.
1. Know Your Audience
Do not show code details to a project manager. Do not show high-level business context to a backend developer unless necessary. Tailor the diagram to the reader’s needs. If you are unsure, create two versions for different groups.
2. Keep Labels Clear
Every box and line should have a meaningful label. Avoid generic names like “Process 1” or “Service A”. Use domain language that reflects the business. If a component handles payments, label it “Payment Processing”.
3. Use Consistent Symbols
Standardize your visual language. Use the same icon for a database across all diagrams. Use the same line style for data flows. Consistency reduces cognitive load for anyone reading the documentation.
4. Maintain the Diagrams
A diagram that does not match the code is worse than no diagram. Treat documentation as code. Update diagrams when the system changes. Integrate diagram updates into the deployment process. If a diagram is hard to update, it will become obsolete.
5. Limit the Scope
Do not try to fit everything into one image. A single page should not contain the entire system. Break complex systems into multiple diagrams. Link them together so users can navigate from context to details.
🚫 Common Pitfalls to Avoid
Even with a good model, mistakes happen. Recognizing common errors helps teams improve their documentation quality over time.
- Mixing Levels: Putting container details inside a context diagram. Keep boundaries strict. If it is a container, it belongs in Level 2.
- Over-Engineering: Creating diagrams that take longer to draw than they are worth. Keep it simple.
- Ignoring Relationships: Drawing boxes without showing how they connect. The value lies in the flow of data.
- Using Proprietary Icons: Avoid obscure symbols that only your team understands. Use standard shapes.
- Static Documentation: Storing diagrams in a document that is never opened again. Keep them accessible and linked.
🔄 The Evolution of Documentation
Software architecture is not static. Systems evolve. New features are added. Legacy parts are retired. The C4 Model supports this evolution by allowing incremental updates.
Start with the System Context. This is the anchor. Once that is agreed upon, expand to Containers. Then, drill down into Components. This incremental approach prevents documentation paralysis. Teams do not need to document everything at once.
🤝 Collaboration and Communication
Diagrams are a shared language. They bridge the gap between business requirements and technical implementation. When architects and developers speak the same visual language, misunderstandings decrease.
During planning meetings, refer to the diagrams. When reviewing pull requests, check if the code matches the component diagram. This alignment ensures that the system being built matches the system being designed.
🔍 Tooling Considerations
There are various software tools available to create these diagrams. The choice of tool depends on team preferences and workflow integration. Some teams prefer manual drawing, while others prefer code-based generation.
Look for tools that support export options. PDF and PNG are standard for sharing. SVG is better for web embedding. Some tools allow integration with version control systems. This feature helps track changes to the architecture over time.
Key Features to Look For
- Template Support: Pre-made shapes for C4 elements.
- Export Formats: Ability to save in multiple formats.
- Collaboration: Real-time editing for remote teams.
- Linking: Ability to link diagrams together.
📝 Final Thoughts on Architecture Visualization
The C4 Model offers a practical framework for simplifying complexity. It does not force a specific technology stack. It does not dictate a specific workflow. It focuses on the fundamental relationships within a system.
Effective architecture documentation is an investment. It pays off in reduced onboarding time and fewer integration bugs. It creates a shared understanding among team members. By adhering to the levels and principles outlined here, teams can maintain a clear view of their software systems.
Remember, the goal is communication. If the diagram helps someone understand the system faster, it has succeeded. Keep the diagrams simple, keep them accurate, and keep them relevant.
📚 Summary of Key Takeaways
- Four Levels: Context, Container, Component, and Code.
- Abstraction: Match the detail to the audience.
- Consistency: Use standard shapes and labels.
- Maintenance: Update diagrams with the code.
- Communication: Use diagrams to align stakeholders.
Adopting this approach leads to better software systems. It reduces ambiguity and increases team efficiency. The art of simple architecture diagrams lies in knowing what to leave out as much as what to put in.

