Software architecture is often described in complex diagrams that can confuse stakeholders, developers, and new team members alike. Without a standard approach, documentation becomes fragmented, inconsistent, and difficult to maintain. The C4 Model provides a structured method for creating clear, consistent, and meaningful diagrams. It helps teams communicate system design effectively across different levels of abstraction.
This guide explores the C4 Model in depth. We will cover the four hierarchical levels, the benefits of adopting this approach, and practical strategies for implementation. Whether you are refining an existing system or starting a new project, understanding these visualization techniques is essential for modern software engineering.
🧩 What is the C4 Model?
The C4 Model is a hierarchical approach to documenting software architecture. It was developed to address the limitations of traditional diagramming methods like UML, which often became too detailed or too abstract depending on the audience. The model organizes diagrams into four distinct levels, each serving a specific purpose.
Instead of trying to show everything in one diagram, the C4 Model encourages separating concerns. This separation allows readers to zoom in or out based on their needs. A project manager might look at the high-level context, while a developer focuses on the component level.
🔑 Key Principles
- Scalability: Diagrams can grow with the system without becoming cluttered.
- Consistency: Standard shapes and colors ensure everyone reads the diagrams the same way.
- Abstraction: Each level hides unnecessary details to focus on specific questions.
- Maintainability: It is easier to update specific diagrams without breaking the whole documentation set.
By adhering to these principles, teams can create documentation that remains useful over time. The model does not prescribe specific tools but rather a mindset for visualization.
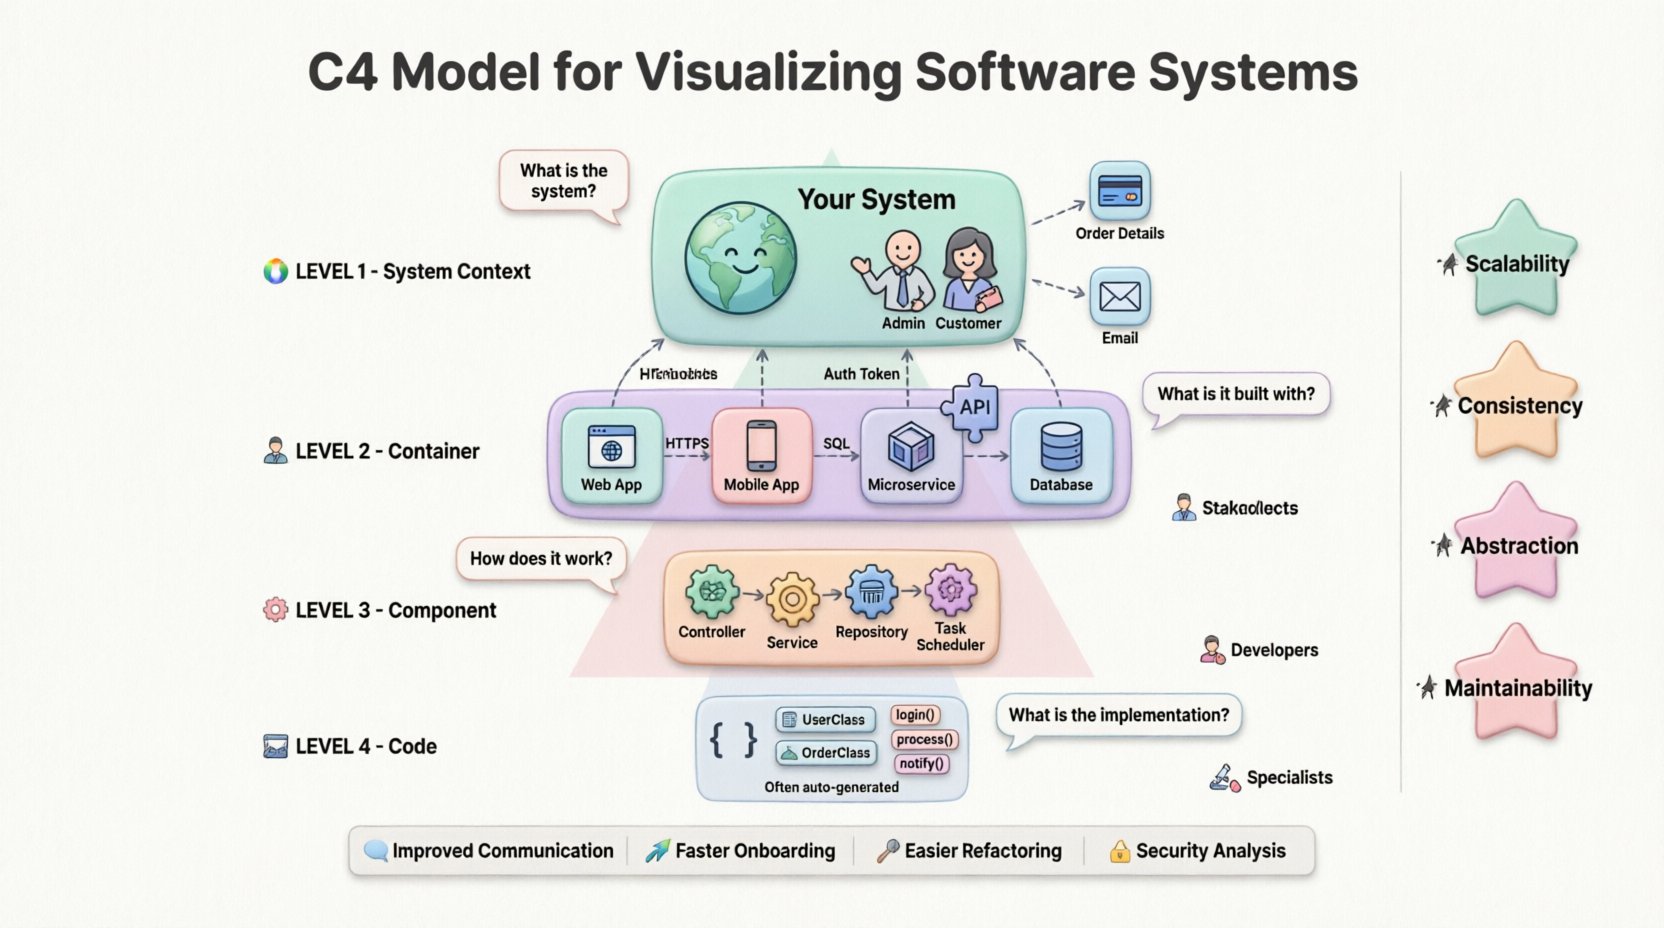
🌍 Level 1: System Context Diagram
The System Context diagram provides the highest level of view. It answers the question: What is the system, and who uses it? This diagram is crucial for new stakeholders who need to understand the boundaries of the software within the wider ecosystem.
📐 Structure and Elements
At this level, the focus is on the system itself and its external relationships. It typically includes:
- System: The central square representing the software being documented.
- People: Users or roles interacting with the system (e.g., Admin, Customer).
- Systems: Other software systems that integrate with the main system (e.g., Payment Gateway, Email Service).
- Connections: Lines showing the flow of data or interaction between entities.
Each connection should include a brief description of the data being exchanged. For example, “Order Details” or “Authentication Token”.
🎯 Purpose
This diagram serves as the anchor for all other diagrams. It defines the scope. If a feature does not appear in the System Context diagram, it is likely outside the current project scope. It is the best starting point for onboarding new developers to a large codebase.
📦 Level 2: Container Diagram
2Once the system boundaries are clear, the Container diagram dives deeper. It answers the question: How is the system built? Here, the focus shifts from external users to the technical building blocks inside the system.
📐 Structure and Elements
A container represents a distinct runtime environment. It is a physical or logical deployment unit. Common examples include:
- Web Applications: Frontend interfaces running in a browser.
- Mobile Applications: iOS or Android apps installed on devices.
- Microservices: Backend services running on servers.
- Databases: Repositories storing persistent data.
- APIs: Interfaces exposing functionality to other systems.
Like the context diagram, connections between containers are labeled with protocols and data types. For instance, a web app might connect to a database using SQL, while a mobile app connects to an API using HTTPS.
🎯 Purpose
This level is vital for architects and senior developers. It helps in understanding technology choices and dependencies. It clarifies how data flows between different parts of the infrastructure. It also aids in identifying single points of failure or security risks within the deployment architecture.
⚙️ Level 3: Component Diagram
The Component diagram zooms in further. It answers the question: How does each container work internally? This level is where the internal logic of a specific container is exposed.
📐 Structure and Elements
Components are logical units of code within a container. They are not physical files but rather functional groups. Examples include:
- Controllers: Handling incoming requests.
- Services: Business logic processors.
- Repositories: Data access layers.
- Tasks: Background job schedulers.
Connections between components show dependencies and data flow. A controller might call a service, which in turn accesses a repository. This hierarchy helps developers understand the separation of concerns.
🎯 Purpose
This diagram is primarily used by developers working on specific features. It reduces cognitive load by showing only the relevant parts of a container. It is useful for planning refactoring efforts or understanding the impact of changes within a microservice.
💻 Level 4: Code Diagram
The Code diagram represents the lowest level of abstraction. It answers the question: How is the logic implemented in code? In practice, this level is often replaced by code comments or inline documentation, as static diagrams can become outdated quickly.
📐 Structure and Elements
This level details classes, interfaces, and methods. It might show:
- Classes: Specific implementations of functionality.
- Interfaces: Contracts defining behavior.
- Methods: Specific functions or procedures.
- Attributes: Data fields within classes.
Because code changes frequently, maintaining a manual diagram at this level is often impractical. Automated tools can generate these views from the source code, but they require constant updates to remain accurate.
🎯 Purpose
This level is useful for debugging or onboarding for very specific technical tasks. It is often more effective to rely on code readability and testing rather than static diagrams for this depth. However, it remains part of the C4 hierarchy for completeness.
📊 Comparison of C4 Levels
Understanding the distinctions between levels is critical for effective documentation. The table below summarizes the differences.
| Level | Question | Focus | Target Audience |
|---|---|---|---|
| 1. System Context | What is the system? | Boundaries & External Users | Stakeholders, Managers, New Hires |
| 2. Containers | How is it built? | Technology & Deployment | Architects, DevOps, Senior Devs |
| 3. Components | How does it work? | Internal Logic & Structure | Developers, Engineers |
| 4. Code | What is the implementation? | Classes & Methods | Specialized Developers |
✅ Benefits of the C4 Model
Adopting the C4 Model brings several tangible advantages to a development team. It moves documentation from a chore to a strategic asset.
🗣️ Improved Communication
When everyone uses the same notation, misunderstandings decrease. Stakeholders can look at a Context diagram and understand the scope without needing technical jargon. Developers can look at a Component diagram and understand dependencies without confusion.
🚀 Faster Onboarding
New team members often struggle to understand a legacy system. A set of C4 diagrams provides a roadmap. They can start with the Context diagram to see the big picture, then drill down into Containers and Components as needed. This reduces the time spent asking questions.
🛠️ Easier Refactoring
When planning changes, developers can update the diagrams alongside the code. If a component is moved or a new container is added, the diagram reflects this immediately. This keeps the documentation synchronized with reality.
🔒 Security Analysis
Security teams can review Container diagrams to identify data flows. They can spot where sensitive data is stored or transmitted. This visual approach makes it easier to identify potential vulnerabilities compared to reading logs or code alone.
🛠️ Implementation Strategies
Implementing the C4 Model requires a shift in how teams approach documentation. It is not about drawing more pictures, but drawing the right pictures.
📝 Start with the Context
Before writing code or designing databases, create the System Context diagram. This forces the team to agree on the boundaries. It prevents scope creep by clearly defining what is inside and outside the system.
🔄 Iterate as You Build
Do not wait until the project is finished to document it. Update the diagrams during the development process. If a new feature is added, add it to the diagram. This ensures the documentation remains relevant.
📏 Keep It Simple
Avoid overcrowding diagrams. If a diagram becomes too complex, split it into multiple views. For example, separate the “User Management” component from the “Reporting” component if they are distinct enough.
🤝 Collaborative Creation
Documentation should not be the responsibility of a single person. Encourage the whole team to contribute to the diagrams. This shared ownership ensures that multiple perspectives are captured.
⚠️ Common Pitfalls
Even with a structured model, teams can make mistakes. Being aware of these pitfalls helps in avoiding them.
- Over-Documenting: Trying to document every single class in a diagram makes it unreadable. Stick to the relevant components.
- Outdated Diagrams: Diagrams that do not match the code are worse than no diagrams at all. They create false trust. Automate updates where possible.
- Inconsistent Notation: Using different shapes or colors for the same types of elements confuses readers. Define a style guide.
- Ignoring the Audience: Showing a Code diagram to a project manager is unhelpful. Match the level of detail to the reader.
- Static vs. Dynamic: Focusing only on static structure ignores the flow of data. Ensure connections explain the interaction, not just the dependency.
🔄 Maintenance and Evolution
Documentation is not a one-time task. Systems evolve, and so must the diagrams. Regular reviews ensure the documentation stays accurate.
📅 Schedule Reviews
Incorporate diagram reviews into sprint planning or release cycles. Ask: Does this diagram match the current state of the system? If not, update it before deploying.
🔗 Link to Code
Where possible, link diagrams to the actual code repositories. This provides traceability. If a developer clicks a component, they should find the relevant source files.
🧹 Clean Up
Remove diagrams that are no longer relevant. A legacy system might have old diagrams that clutter the documentation. Keeping the set lean makes it easier to find what matters.
🌟 Conclusion
The C4 Model offers a pragmatic solution to the challenge of software documentation. It balances detail with clarity, allowing teams to communicate complex architectures effectively. By using the four levels—Context, Container, Component, and Code—teams can create a structured narrative of their software.
Adopting this model requires discipline, but the long-term benefits are significant. Improved communication, faster onboarding, and better system understanding make it a valuable investment for any software organization. As technology continues to evolve, the need for clear visualization will only grow.
Start by mapping your current system using the C4 approach. You may discover gaps in your understanding or new opportunities for optimization. The goal is not perfection, but clarity.

