Software architecture is often invisible until it breaks. When systems become complex, the mental models held by different team members diverge. This divergence leads to miscommunication, flawed designs, and technical debt. To bridge this gap, the industry requires a standardized approach to visualizing software structure. The C4 model provides this structure. It is a collection of hierarchy diagrams that help you describe software architecture in a way that is clear, consistent, and useful for all stakeholders.
Why Visual Models Matter 🖼️
Words alone are often insufficient to convey the complexity of a distributed system. Code is too detailed for high-level planning, while high-level text lacks the specificity needed for implementation. Visual diagrams serve as the shared language between architects, developers, product owners, and operations teams.
Without a structured modeling approach, diagrams tend to become cluttered and inconsistent. Some focus on infrastructure, others on code flow, and some on user journeys. This lack of standardization makes it difficult to onboard new team members or understand legacy systems. The C4 model addresses this by defining four specific levels of abstraction.
Using a consistent framework offers several benefits:
- Shared Understanding: Everyone sees the same diagram with the same meaning.
- Scalability: You can zoom in and out without losing context.
- Maintainability: Documentation stays relevant as the system evolves.
- Communication: You can tailor the view to the audience without creating multiple unrelated diagrams.
What is the C4 Model? 🧩
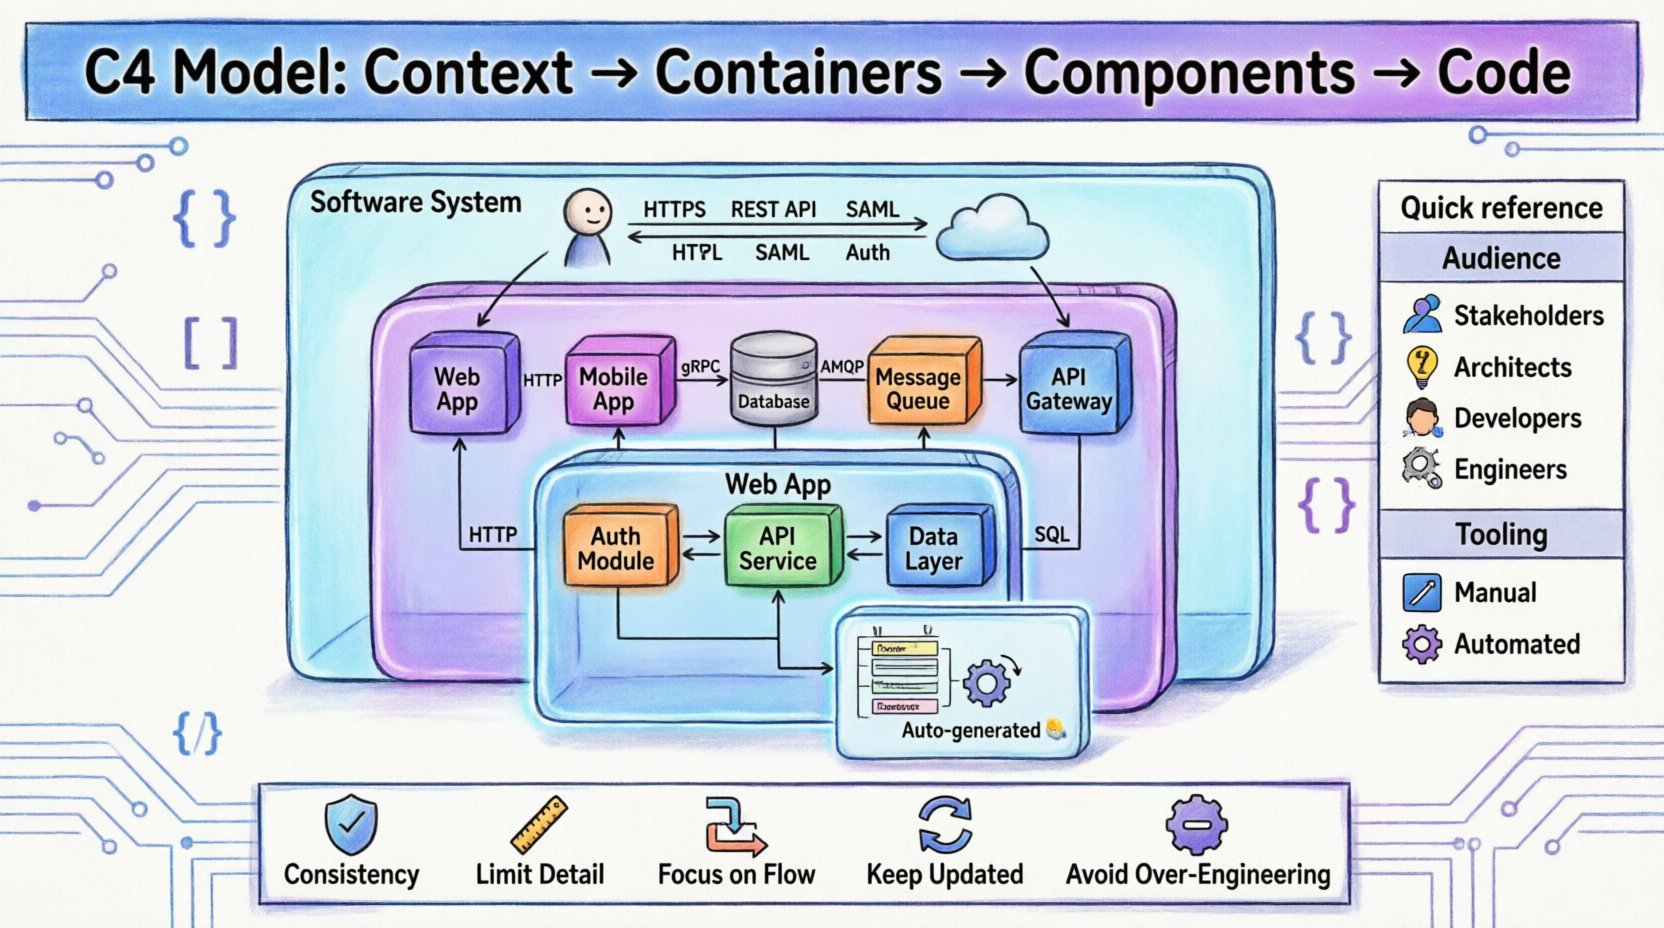
The C4 model stands for Context, Containers, Components, and Code. It is a hierarchical approach to software architecture documentation. Each level adds a layer of detail, allowing you to drill down from the business context to the implementation details.
This model was developed to solve the problem of “big ball of mud” diagrams that try to show everything at once. By separating concerns into distinct levels, the C4 model ensures that each diagram has a single, clear purpose. It encourages a top-down approach, starting with the system boundary and working inward.
Here is a breakdown of the core philosophy:
- It is not a methodology: It does not tell you how to design the software, only how to document it.
- It is not a tool: It works with any diagramming software or modeling platform.
- It is dynamic: Diagrams should be generated from code or configuration where possible to avoid drift.
Level 1: System Context 🌍
The System Context diagram provides the highest level of abstraction. It answers the question: What does this software system do, and who or what interacts with it?
This diagram is primarily intended for stakeholders who are not involved in the day-to-day coding, such as product managers, executives, and business analysts. It defines the boundaries of the system and the external entities that rely on it.
Key Elements of a System Context Diagram
- The Software System: Represented as a large rectangle in the center. This is the boundary of your project.
- People: End users, administrators, or support staff interacting with the system.
- Other Systems: External services, databases, APIs, or legacy systems that communicate with your software.
- Relationships: Lines connecting the system to people and other systems, labeled with the type of data or interaction (e.g., “User data”, “Authentication requests”).
When creating this level, focus on the value proposition. Do not include internal details. Keep the diagram simple. If it cannot be understood in thirty seconds, it is too complex.
Level 2: Containers 📦
Once the boundary is established, we need to understand what makes up the system. The Containers diagram breaks the software system into deployable units. A container is a distinct, running process, such as a web application, a mobile app, a database, or a serverless function.
This level is crucial for software architects and senior developers. It answers: What technologies are we using, and how do they communicate?
Key Elements of a Container Diagram
- Containers: Represented as cylinders or boxes. Examples include a web server, a mobile client, a database, or a message queue.
- Communication: Lines showing protocols (HTTP, gRPC, TCP) and data flow between containers.
- External Systems: You may still show external dependencies, but the focus is internal.
A common mistake at this level is to mix internal components with external containers. Remember, a container is a deployment unit. If two components run in the same process, they belong in the same container. If they are deployed separately, they are separate containers.
Level 3: Components ⚙️
Inside a container, there is logic and structure. The Components diagram zooms in to show how a container is built. It represents the internal architecture of a specific container.
This level is designed for developers working on that specific part of the system. It answers: How is this container organized, and what are the responsibilities of its parts?
Key Elements of a Component Diagram
- Components: These are logical groupings of code. They could be a class, a module, a package, or a microservice.
- Responsibilities: Each component should have a single, clear responsibility (Single Responsibility Principle).
- Interfaces: Connections between components should show how they communicate (e.g., API calls, method invocations).
- Data Stores: If a component manages local data, it can be represented within the container.
This diagram helps identify coupling and cohesion. If you see too many lines crossing between components, it may indicate a need for refactoring. It is also useful for onboarding new developers to a specific microservice.
Level 4: Code 💻
The Code level represents the implementation details. It shows the classes, interfaces, and methods that make up a component. While the previous levels are about architecture, this level is about engineering.
For most projects, this level is generated automatically from the source code. It is rarely drawn manually because code changes frequently. Manual diagrams at this level quickly become outdated.
When to Use the Code Level
- Complex Algorithms: When a specific algorithm needs explanation.
- Legacy Systems: When understanding the internal structure of old code is necessary.
- Onboarding: To help new developers understand the specific class hierarchy.
Automated documentation tools are best suited for this level. They ensure the diagrams remain synchronized with the codebase. If you are drawing this manually, be prepared to update it with every significant code change.
Building a Hierarchy of Detail 📊
The power of the C4 model lies in the hierarchy. You do not need to create all four levels for every system. You choose the level that matches your audience and your need.
Consider the following workflow:
- Start with Context: Define the boundary. Get stakeholder sign-off.
- Move to Containers: Plan the infrastructure and technology stack.
- Drill into Components: Design the internal logic for critical services.
- Reference Code: Use automated tools to visualize implementation if needed.
This hierarchy prevents information overload. A stakeholder does not need to see the class diagrams to understand the business value. A developer does not need to see the business context to write the function logic.
| Level | Focus | Audience | Tooling |
|---|---|---|---|
| Level 1: Context | System Boundary | Stakeholders, Managers | Manual |
| Level 2: Containers | Deployable Units | Architects, DevOps | Manual or Semi-Auto |
| Level 3: Components | Internal Logic | Developers | Manual or Auto |
| Level 4: Code | Implementation | Engineers | Automated |
Best Practices for Diagramming 📝
Creating diagrams is an art as much as a science. To ensure your documentation remains useful, follow these guidelines.
1. Consistency is Key
Use the same shapes and colors for the same types of elements across all diagrams. If a database is a cylinder in Level 1, it must be a cylinder in Level 2. This reduces cognitive load when switching between views.
2. Limit the Detail
Do not show every single method or every single connection. If a container has ten components, only show the main ones. If you show everything, the diagram becomes a wall of text. Group related items together.
3. Focus on Flow
Diagrams should tell a story. Use arrows to indicate the direction of data flow. This helps readers understand how information moves through the system, which is often more important than static structure.
4. Keep it Updated
An outdated diagram is worse than no diagram. It gives false confidence. Integrate diagram generation into your build pipeline if possible. If manual, assign ownership to keep them current.
5. Avoid Over-Engineering
Not every project needs a full C4 suite. A simple startup might only need a System Context and a Container diagram. A complex enterprise system might require all four. Scale your documentation to the complexity of your product.
Maintaining Your Documentation 🔄
Documentation rot is a common issue in software development. As features are added and technologies change, diagrams become obsolete. To combat this:
- Automate Generation: Use tools that read your code or configuration files to generate diagrams. This ensures the diagram always matches the code.
- Version Control: Store your diagrams in the same repository as your code. This ensures they are versioned alongside the changes.
- Review Process: Include diagram updates in your code review process. If the code changes the architecture, the diagram must change too.
- Single Source of Truth: Do not maintain a separate wiki for diagrams if the code repository can hold them. Redundancy leads to drift.
Common Pitfalls to Avoid ⚠️
Even with a good framework, mistakes happen. Here are common errors to watch out for.
1. Mixing Levels
Do not show component details inside a container diagram. If you need to show components, make a new diagram. Mixing levels creates confusion about what is a deployment unit and what is a logical module.
2. Ignoring External Systems
In Level 2, it is tempting to only show internal containers. However, understanding dependencies is critical. Always show how your containers talk to external databases or third-party APIs.
3. Too Many Connections
Spider diagrams with lines connecting everything are useless. Aim for a sparse graph. If a connection is implied or trivial, leave it out. Focus on the critical paths.
4. Using Specific Tool Names
When documenting the architecture, do not rely on specific vendor terminology unless it is industry standard. Focus on the concept (e.g., “Web Server”) rather than the brand (e.g., “Apache HTTP Server”) unless the brand is the architectural constraint.
Integrating into Team Workflows 🤝
For the C4 model to be effective, it must be part of the daily workflow, not a separate task for the architect.
1. Onboarding
Use Level 1 and Level 2 diagrams as the first thing new hires see. This gives them a mental map of the system before they touch the code.
2. Design Discussions
Use Level 2 and Level 3 diagrams during design reviews. Sketching out how a new feature fits into the containers helps identify architectural risks early.
3. Incident Response
When a production issue occurs, diagrams help teams understand the blast radius. If a database fails, which containers depend on it? Level 2 diagrams answer this quickly.
4. Knowledge Sharing
Rotate the responsibility for maintaining diagrams. If only one person understands the architecture, you have a single point of failure. Encourage the team to update and review the visuals.
Final Thoughts 🌟
Effective technical communication is not about creating beautiful pictures. It is about conveying information accurately and efficiently. The C4 model provides a proven structure to achieve this. By separating concerns into Context, Containers, Components, and Code, you create a shared language that scales with your team.
Start simple. Define your system boundary. Build your containers. Drill down where necessary. Keep your diagrams updated. With discipline and consistency, the C4 model becomes a living asset that reduces risk and accelerates development.
Remember, the goal is not perfection. The goal is clarity. If your team can look at a diagram and understand the system, you have succeeded.

