Software systems are becoming increasingly complex. As teams grow and systems expand, the need for clear, scalable documentation becomes critical. The C4 Model provides a structured approach to visualizing software architecture. It is not merely a drawing style; it is a communication tool designed to help teams understand and evolve their systems over time. This guide explores how the C4 Model serves as a foundation for continuous architecture, ensuring documentation remains relevant as the code changes.
🤔 What is the C4 Model?
The C4 Model is a hierarchical approach to documenting software architecture. It categorizes diagrams into four distinct levels of abstraction. This hierarchy allows stakeholders to view the system at a level appropriate to their needs. A developer might need to see code-level details, while a product owner only requires a high-level overview. By standardizing these views, the model reduces ambiguity and aligns understanding across the organization.
Unlike static documentation that becomes obsolete quickly, the C4 Model encourages a living documentation practice. It fits naturally into the development lifecycle. Teams can update diagrams alongside code changes, ensuring the architecture reflects reality. This continuous approach prevents the gap between design and implementation that often plagues large projects.
🔍 Core Principles
- Abstraction: Each level hides unnecessary detail to focus on specific concerns.
- Consistency: Standard shapes and notation ensure diagrams are readable by anyone.
- Scalability: The model works for small scripts and massive distributed systems alike.
- Maintainability: Diagrams are kept up-to-date through continuous integration practices.
📊 The Four Levels of Abstraction
Understanding the hierarchy is essential for applying the model effectively. Each level answers a specific question about the system. The progression moves from the broadest context down to specific implementation details.
| Level | Diagram Type | Focus | Key Question |
|---|---|---|---|
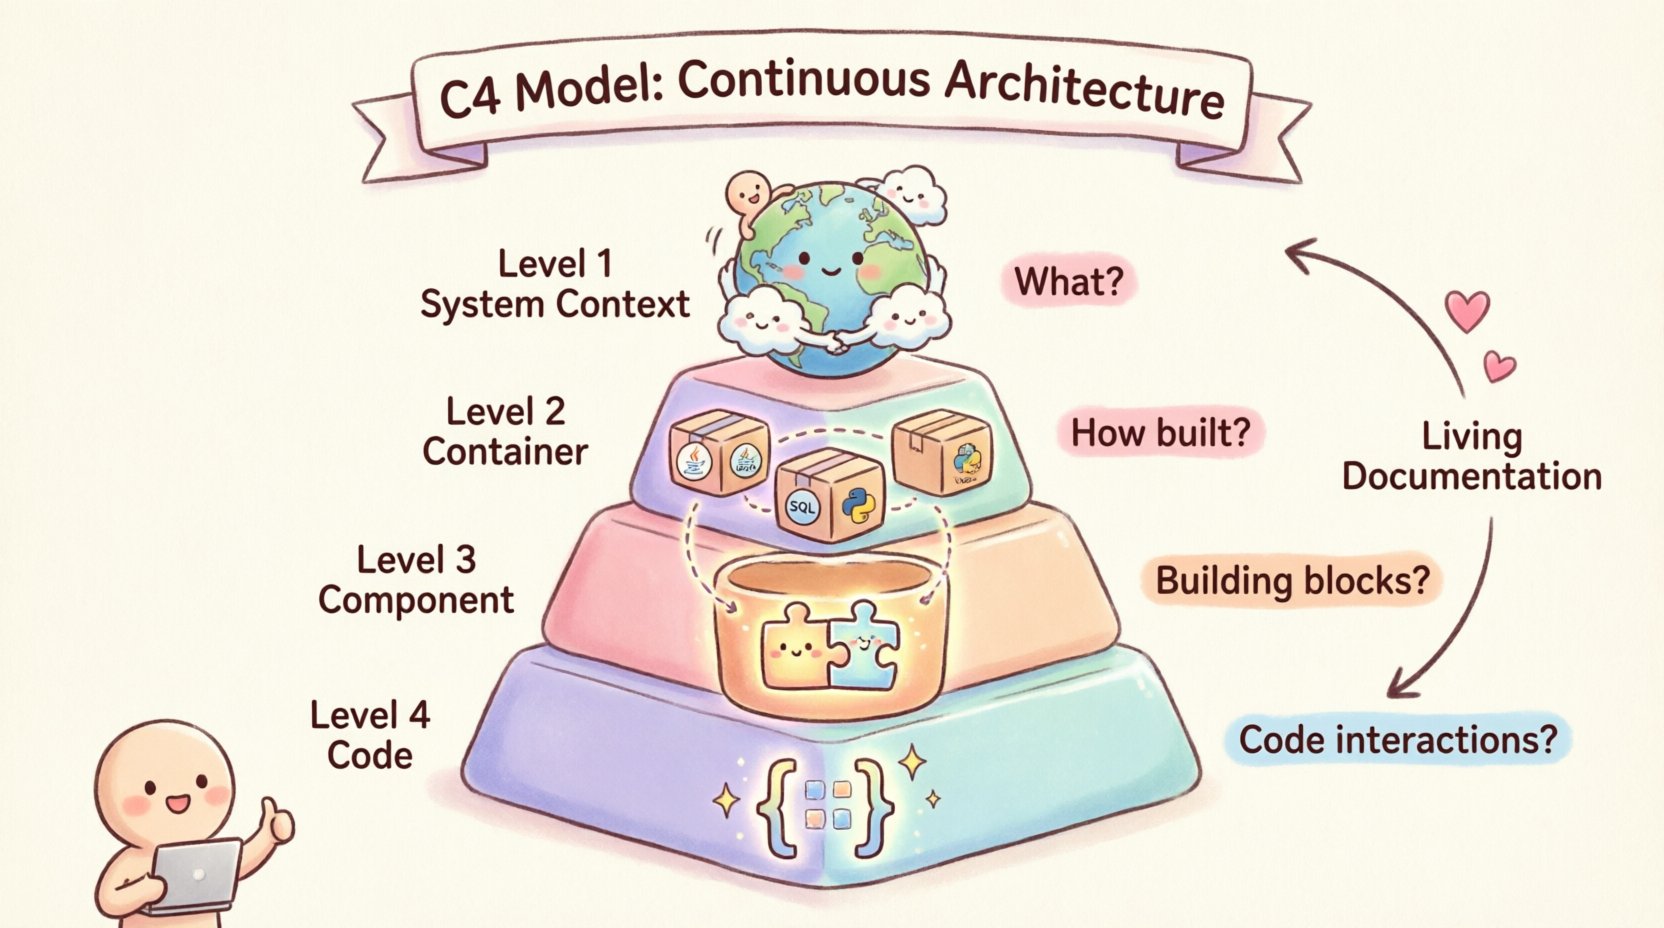
| Level 1 | System Context | System and Users | What is the system and who uses it? |
| Level 2 | Container | Runtime Environments | How is the system built? |
| Level 3 | Component | Internal Structure | What are the major building blocks? |
| Level 4 | Code | Classes and Objects | How does the code interact? |
🌍 Level 1: System Context Diagram
The System Context diagram is the starting point. It provides a bird’s-eye view of the software system. This diagram is typically the first one created for any new project. It places the system in its environment, showing how it interacts with people and other systems.
Key Elements:
- Software System: Represented as a large box in the center.
- Users: People or roles interacting with the system, such as administrators or customers.
- External Systems: Third-party services or legacy systems that the software communicates with.
- Relationships: Arrows showing the flow of data or commands between entities.
This level is crucial for onboarding new team members. It answers the question of where the system fits in the broader business landscape. It also helps identify dependencies on external services early in the design phase.
🏛️ Level 2: Container Diagram
Once the context is understood, the focus shifts inward. The Container diagram breaks down the system into its runtime parts. A container is a high-level logical unit of code that is deployed and runs at runtime. Examples include web applications, mobile applications, microservices, and databases.
Key Elements:
- Containers: Boxes representing distinct technologies or deployment units.
- Technologies: Labels indicating the underlying technology stack, such as Java, Python, SQL, or NoSQL.
- Connections: Lines showing how containers talk to each other, including protocols like HTTP, gRPC, or TCP.
This level bridges the gap between business requirements and technical implementation. It helps architects decide on the technology stack. It also highlights how the system is distributed across different environments, such as cloud instances or on-premise servers.
🧱 Level 3: Component Diagram
Inside each container, the Component diagram reveals the internal structure. Components are logical groupings of functionality. They are not physical files on a disk but rather conceptual modules that perform specific tasks.
Key Elements:
- Components: Smaller boxes inside the container representing features or services.
- Responsibilities: A brief description of what the component does.
- Interfaces: Points where the component connects to other components.
- Dependencies: Relationships showing which components rely on others.
At this level, developers can plan the internal organization of the codebase. It is useful for refactoring and understanding code ownership. By isolating components, teams can assign ownership to specific groups, reducing bottlenecks.
💻 Level 4: Code Diagram
Level 4 is optional and is rarely needed for high-level architecture. It zooms in on the code itself. This level shows classes, interfaces, and objects. It is primarily useful for specific algorithmic discussions or when explaining complex logic.
Key Elements:
- Classes: The fundamental building blocks of the code.
- Methods: Functions or operations performed by the classes.
- Attributes: Data stored within the classes.
Because code changes frequently, maintaining this level of diagram is difficult. It is best used for temporary documentation or specific problem-solving sessions rather than permanent architecture records.
🔄 Integrating C4 into Continuous Architecture
The true power of the C4 Model lies in its ability to support continuous architecture. Architecture is not a one-time event; it is an ongoing process. As requirements change, the system must evolve. The C4 Model provides a framework to manage this evolution without losing clarity.
📝 Living Documentation
Documentation should not be a separate artifact. It should be part of the code repository. This ensures that diagrams are versioned alongside the source code. When a developer commits a change, the diagram should ideally be updated as part of the same workflow.
Best Practices:
- Store Diagrams in Git: Keep diagram files in the same repository as the code.
- Automate Updates: Use tools that generate diagrams from code or configuration files where possible.
- Review in PRs: Include diagram updates in pull request reviews to ensure alignment.
🛠️ Tooling Agnostic Approach
You do not need a specific tool to use the C4 Model. The value comes from the structure, not the software used to draw it. You can use diagramming tools, code-based documentation, or even markdown files.
However, consistency is key. Choose a standard for shapes and colors. For example, always use a specific color for databases or a specific shape for external systems. This reduces cognitive load when reading multiple diagrams.
✅ Benefits for Development Teams
Adopting this framework offers tangible benefits for engineering teams. It improves communication, speeds up onboarding, and aids in decision-making.
🗣️ Improved Communication
Visuals speak louder than text. A well-structured diagram can explain a complex system in seconds. This reduces the need for lengthy meetings to explain system flow. Stakeholders can look at a System Context diagram and understand the scope immediately.
👥 Faster Onboarding
New hires often struggle to understand how a large codebase is organized. The C4 Model provides a roadmap. Starting with Level 1 and diving deeper into Level 2 and 3 allows new engineers to learn the system incrementally. This reduces the time to productivity.
🧠 Better Decision Making
When planning changes, architects need to understand the impact. A Component diagram shows dependencies clearly. If you change one component, you can see exactly which others might be affected. This reduces the risk of breaking existing functionality during refactoring.
📝 Practical Implementation Steps
Implementing the C4 Model does not require a massive overhaul. You can start small and grow the documentation as the system matures.
- Start with Level 1: Draw the System Context diagram first. Define the boundaries of the system.
- Identify Containers: List the major runtime units. Decide on the technology stack for each.
- Map Connections: Draw the data flow between containers. Note protocols and data types.
- Drill Down: Select the most complex containers and create Component diagrams for them.
- Review Regularly: Schedule time to review and update diagrams during sprint planning or retrospectives.
⚠️ Common Pitfalls to Avoid
Even with a solid framework, teams often make mistakes that reduce the value of the diagrams. Being aware of these common issues helps maintain quality.
🚫 Over-Engineering
Do not try to create diagrams for every single class. The goal is clarity, not completeness. If a diagram is too complex to understand, it has failed. Simplify the view to show only what is necessary for the current context.
🚫 Outdated Information
A diagram that does not match the code is worse than no diagram. It creates false expectations. If you cannot keep the diagrams updated, do not create them. Focus on code comments or tests instead.
🚫 Inconsistent Notation
Using different shapes for the same type of element confuses readers. Establish a style guide early. Define what a database looks like and stick to it. Define how to represent external systems and keep it consistent.
💡 Enhancing the Continuous Workflow
Integrating architecture documentation into the continuous integration and deployment pipeline is the next step. This ensures that architectural drift is caught early.
- Static Analysis: Use code analysis tools to verify that the architecture matches the implementation.
- Automated Checks: Set up scripts to flag when code changes violate architectural boundaries.
- Feedback Loops: Ensure that feedback from operations and testing informs the architecture diagrams.
This approach turns architecture into a guardrail rather than a gate. It allows teams to move fast without compromising the structural integrity of the system.
🔍 Conclusion
The C4 Model offers a pragmatic solution to the challenge of documenting complex software systems. By organizing information into four clear levels, it caters to different audiences and needs. When applied as a continuous practice, it keeps documentation aligned with the codebase.
Teams that adopt this framework benefit from clearer communication, faster onboarding, and more confident decision-making. The key is consistency and maintenance. Treat the diagrams as code: version them, review them, and update them. In doing so, architecture becomes a living asset that supports the team rather than a burden that hinders progress.
Start with the System Context. Build outward as needed. Keep it simple. This framework provides the structure required to navigate the complexity of modern software development.
