


The landscape of software architecture is shifting beneath our feet. For years, the C4 Model has provided a clear, hierarchical approach to visualizing system structure. It brought order to chaos, helping teams communicate complex designs through standardized levels: Context, Container, Component, and Code. However, as technology matures, so must our methods of documentation. Static diagrams are no longer sufficient for dynamic, cloud-native ecosystems. This guide explores the trajectory of the C4 Model and what lies ahead for architecture visualization.
📚 Understanding the Foundation
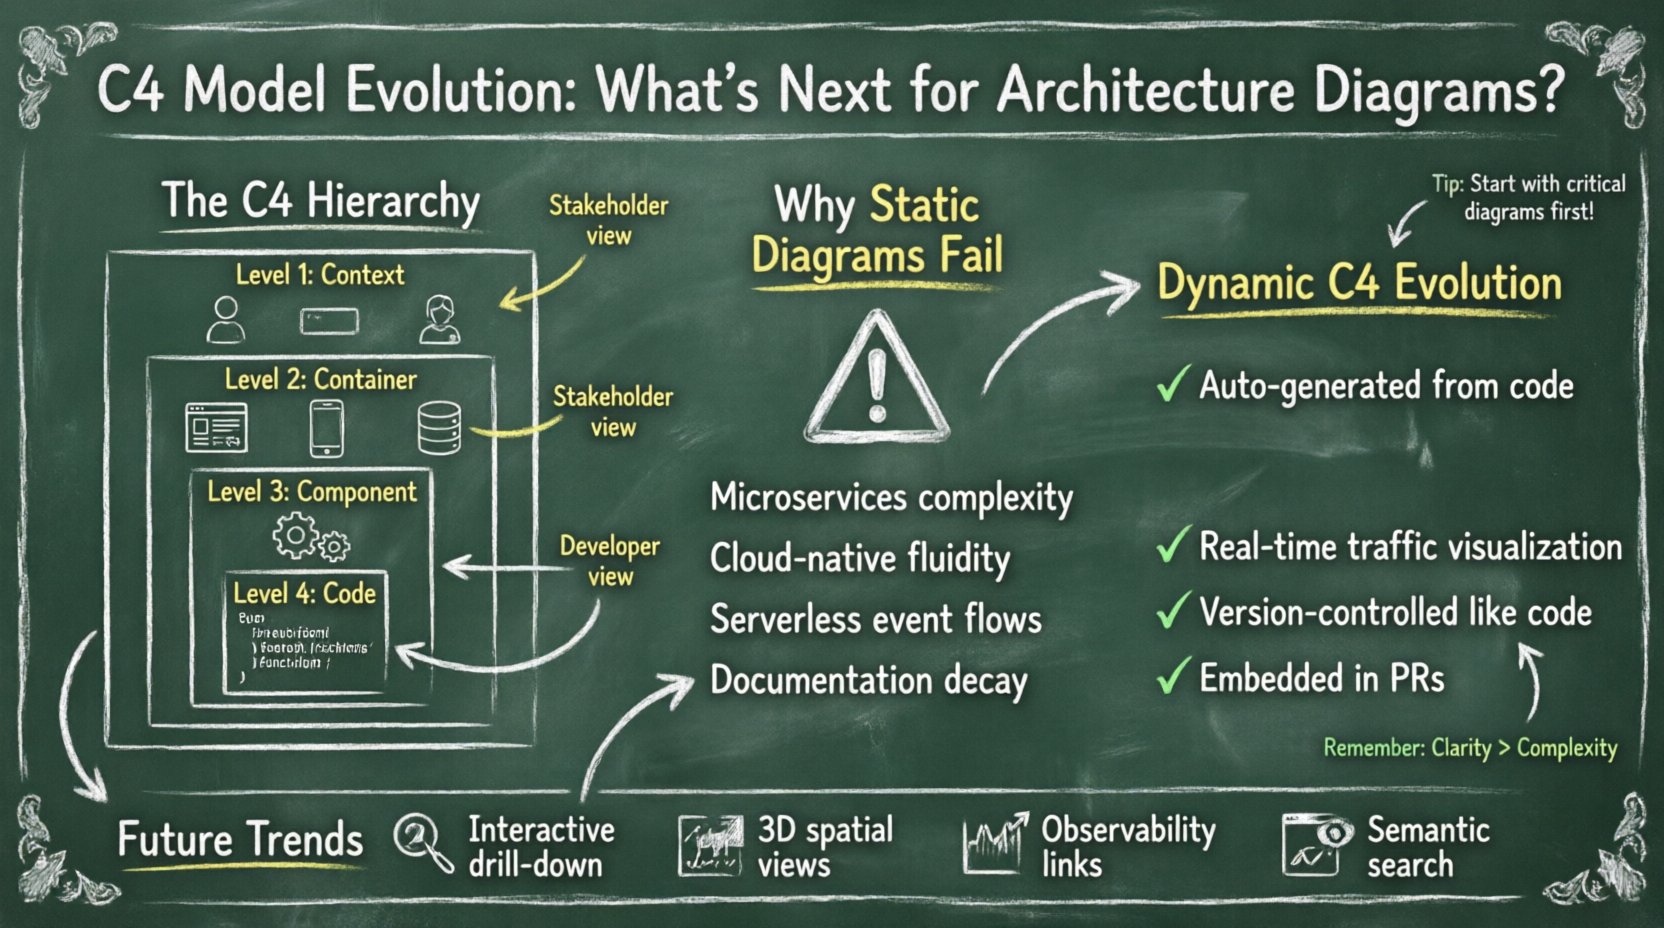
Before discussing the future, we must acknowledge the present. The C4 Model was designed to solve a specific problem: the difficulty of conveying architectural intent to different stakeholders. It achieves this through abstraction.
- Level 1: Context – Shows the system within its environment. It highlights users, external systems, and high-level interactions.
- Level 2: Container – Depicts the high-level technical building blocks. Think web apps, mobile apps, databases, or data lakes.
- Level 3: Component – Breaks down containers into major logical components. These are groups of related functionality that can be deployed together.
- Level 4: Code – Represents the internal structure of components, often mapping to classes or functions.
This hierarchy works because it allows you to zoom in and out. A stakeholder might only care about Level 1, while a developer needs Level 3. The model provides a shared language. Yet, as systems become more distributed and ephemeral, the static nature of these diagrams faces challenges.
🌐 The Modern Architecture Challenge
Traditional architecture diagrams were often created once, saved as an image, and then ignored until the next major release. In today’s continuous delivery environments, this approach leads to documentation decay. The code changes, but the diagram does not. This creates a dangerous gap between what is documented and what is actually running.
Key Factors Driving Change
- Microservices Complexity – Systems are no longer monolithic. They are collections of services communicating over networks. Tracking dependencies across dozens of containers requires dynamic visibility.
- Cloud-Native Infrastructure – Infrastructure is defined as code. Resources are spun up and torn down automatically. Static maps cannot capture this fluidity.
- Serverless Computing – Functions run without dedicated containers. The traditional “Container” level becomes less relevant as execution models shift to event-driven flows.
- AI and Automation – We are moving toward systems that can generate and update their own documentation based on code changes.
🔄 The Shift to Dynamic Diagramming
The next evolution of the C4 Model lies in dynamic visualization. Instead of a static snapshot, architecture diagrams should reflect the live state of the system. This requires a shift from manual drawing to automated generation.
Benefits of Dynamic Diagrams
- Accuracy – Diagrams are generated from the source code or deployment configuration. If the code changes, the diagram updates.
- Real-Time Context – You can visualize actual traffic flows and latency issues, not just theoretical paths.
- Reduced Maintenance – Teams spend less time redrawing boxes and more time fixing actual issues.
- Version Control – Diagrams become part of the repository. You can track changes in architecture over time just like code.
🧩 Semantic Modeling and Metadata
For diagrams to be dynamic, the underlying data must be structured. This leads to the concept of semantic modeling. Instead of drawing boxes on a canvas, developers define the system structure in a code-based format. This metadata is then rendered into the C4 hierarchy automatically.
This approach offers several advantages:
- Single Source of Truth – The definition of the system lives in the code repository, not in a separate design file.
- Validation – Automated checks can ensure that the architecture matches the deployment configuration.
- Integration – Diagrams can be embedded directly into pull requests, providing immediate visual context for reviewers.
📊 Comparing Approaches
To understand the shift, we must compare the traditional method with the emerging paradigm.
| Feature | Traditional C4 | Modern C4 Evolution |
|---|---|---|
| Creation Method | Manual drawing tools | Code-based generation |
| Update Frequency | Event-driven (releases) | Continuous (CI/CD pipeline) |
| Accuracy | High risk of drift | High accuracy, near real-time |
| Accessibility | Static images (PNG/SVG) | Interactive, web-based views |
| Integration | Separate from code | Part of the codebase |
| Maintenance Cost | High | Low |
🛠️ The Code-Level Evolution
Level 4 of the C4 Model (Code) is often the most granular and least used for high-level communication. However, in the evolution of architecture diagrams, this level is becoming more significant. With the rise of abstraction layers, the boundary between code and component is blurring.
Future diagramming tools will likely integrate more deeply with compilers and static analysis tools. This allows for:
- Dependency Visualization – Automatically mapping library imports to architectural components.
- Interface Mapping – Showing how APIs are consumed and produced within the codebase.
- Refactoring Impact – Visualizing which parts of the system will break if a specific class changes.
🤖 The Role of Artificial Intelligence
Artificial Intelligence is beginning to influence how we document systems. While not replacing human judgment, AI can assist in the diagramming process.
AI Applications in Architecture
- Generation – AI can analyze code repositories and suggest initial C4 diagrams.
- Refinement – AI can recommend layout optimizations to reduce visual clutter.
- Consistency Checks – AI can flag inconsistencies between the code and the diagram.
- Natural Language Queries – Developers can ask questions about the architecture, and the system retrieves relevant diagram fragments.
👥 Collaboration and Culture
Technology is only half the battle. The evolution of the C4 Model also requires a shift in team culture. Documentation cannot be an afterthought. It must be integrated into the development workflow.
Best Practices for Modern Teams
- Diagram as Code – Treat diagrams like source code. Use version control, review them in pull requests, and automate their generation.
- Living Documentation – Accept that documentation is a product that needs maintenance. Assign ownership for keeping it up to date.
- Contextual Relevance – Ensure diagrams are tailored to the audience. Executives need different views than engineers.
- Standardization – Maintain consistent naming conventions and iconography across the organization.
⚠️ Common Pitfalls to Avoid
As we adopt new methods, we must be wary of new traps. The goal is clarity, not complexity.
- Over-Engineering – Do not try to map every single class. Keep the focus on high-level structure.
- Tool Dependency – Do not rely on a specific vendor. Ensure your diagrams can be exported or migrated if the tool changes.
- Visual Clutter – Avoid showing too much detail at once. Use the C4 hierarchy to hide complexity when necessary.
- Ignoring Human Factors – A perfect diagram is useless if no one reads it. Ensure the output is readable and accessible.
🔮 Future Trends in Visualization
Looking further ahead, several trends are emerging that will shape the next decade of architecture diagrams.
- Interactive Explorers – Diagrams will become clickable portals. Clicking a container might drill down into the component level automatically.
- 3D and Spatial Views – For highly complex systems, 3D visualization might help understand physical deployment locations.
- Integration with Observability – Diagrams will link directly to monitoring tools. Clicking a component might show current error rates or latency.
- Semantic Search – Searching for a feature will highlight the relevant parts of the architecture diagram.
🧭 Navigating the Transition
Moving from static to dynamic architecture diagrams is not an overnight switch. It requires planning and gradual adoption. Teams should start by identifying their most critical diagrams and automating those first.
Here is a suggested path forward:
- Assess Current State – Review existing diagrams. Are they accurate? Are they maintained?
- Define Standards – Establish rules for how diagrams should be created and stored.
- Implement Automation – Integrate diagram generation into the build pipeline.
- Train Teams – Ensure everyone understands how to use the new tools and why they matter.
- Iterate – Gather feedback and refine the process continuously.
🛡️ Security and Compliance Considerations
As diagrams become more integrated with code and infrastructure, security becomes a concern. Sensitive information might inadvertently be exposed in generated diagrams.
Teams must consider:
- Access Control – Who can view the architecture diagrams? Ensure only authorized personnel see sensitive infrastructure details.
- Data Masking – Remove or anonymize sensitive identifiers in generated views.
- Audit Trails – Keep a record of who viewed or modified the architecture documentation.
🎯 Final Thoughts on Architecture Documentation
The C4 Model remains a robust framework, but its implementation must evolve. The future belongs to systems that are self-documenting, dynamic, and integrated into the development lifecycle. By embracing automation and semantic modeling, teams can ensure their architecture diagrams remain valuable assets rather than obsolete artifacts.
Success in this area depends on balancing technical capability with human readability. The best diagram is the one that is actually used to make decisions. As we move forward, prioritize clarity, accuracy, and maintainability. This ensures that architecture documentation continues to serve its purpose: enabling teams to build better systems.

