Software architecture is often a source of friction. Developers spend hours debating implementation details while the bigger picture fades into the background. Diagrams are supposed to clarify, yet they frequently become outdated sources of confusion. The challenge is not just drawing lines between boxes, but creating a shared language that everyone on the team understands. The C4 Model provides a structured approach to this problem. It breaks down complex systems into manageable layers, ensuring that the right information reaches the right people at the right time.
This guide explores how to apply the C4 Model to foster collaboration. We will move beyond simple definitions and discuss practical application, maintenance, and the cognitive benefits of structured abstraction. By adopting this framework, teams can reduce ambiguity and improve the speed of decision-making.
🔍 Understanding the Hierarchy of Abstraction
The core strength of the C4 Model lies in its hierarchy. Instead of trying to show everything in one massive diagram, it encourages progressive refinement. Each level answers a specific set of questions for a specific audience. This separation of concerns prevents information overload.
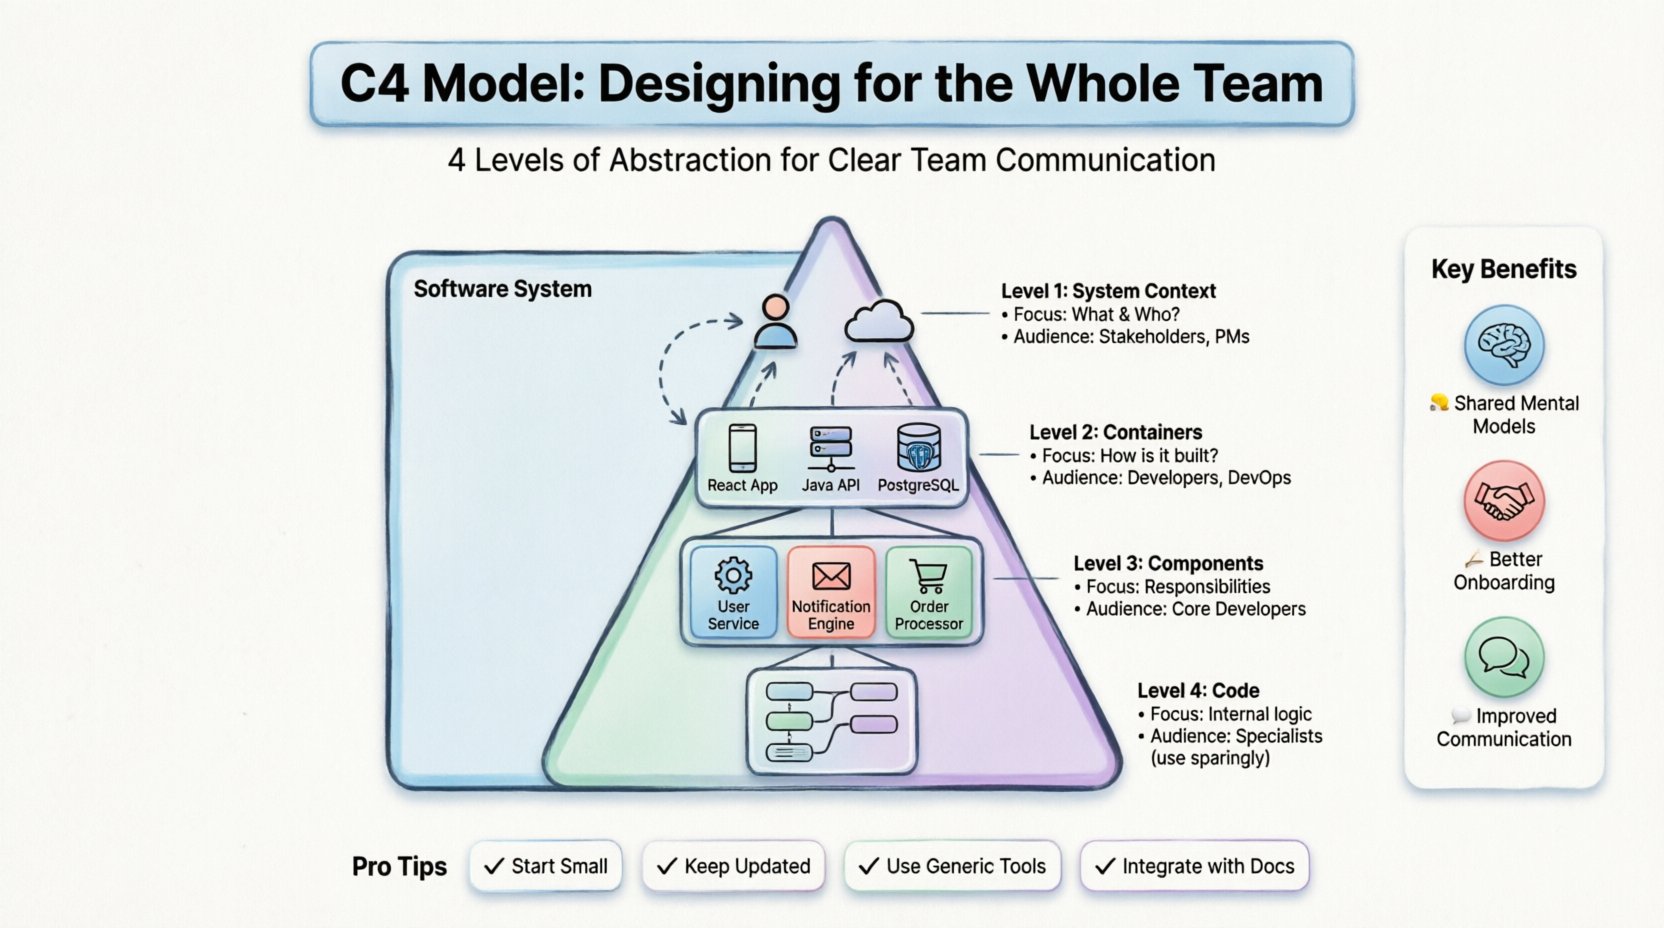
1. Level 1: System Context Diagram
The System Context Diagram is the starting point. It shows the software system as a single box and its relationships with people and other systems. This is the “elevator pitch” view of the architecture.
- Focus: What is the system, and who interacts with it?
- Audience: Stakeholders, product managers, and new team members.
- Key Elements:
- The system itself (represented as a single box).
- External users (people or roles).
- External systems (third-party APIs, databases, legacy software).
- Relationships (data flows, interactions).
At this level, technical details are irrelevant. The goal is to establish boundaries. It clarifies what is inside the system and what remains outside. This is crucial for defining scope and understanding dependencies without getting lost in implementation logic.
2. Level 2: Container Diagram
Once the boundaries are clear, we peel back the skin of the system to reveal its containers. A container is a distinct deployable unit of software. Examples include web applications, mobile apps, microservices, or databases.
- Focus: How is the system built?
- Audience: Developers, DevOps engineers, and technical leads.
- Key Elements:
- Containers (technologies used, e.g., Java application, React frontend, PostgreSQL database).
- Connections between containers (protocols, ports, data formats).
- External systems (if not shown in Level 1).
This level is vital for understanding technology choices. It helps answer questions about data persistence, authentication flows, and deployment boundaries. It bridges the gap between business requirements and technical implementation.
3. Level 3: Component Diagram
Inside a container, we find components. A component is a logical grouping of functionality. Unlike containers, components are not necessarily deployed separately; they exist within the runtime of the container.
- Focus: What are the responsibilities within a container?
- Audience: Core developers, architects, and reviewers.
- Key Elements:
- Components (e.g., User Service, Order Processor, Notification Engine).
- Relationships (API calls, data access, events).
- Interfaces (how components communicate).
This level is where design patterns often live. It helps teams identify coupling and cohesion. By breaking a container into components, teams can assign ownership of specific responsibilities. This supports microservice design and modular monoliths alike.
4. Level 4: Code Diagram
The final level zooms in on the code itself. This involves class diagrams or object structures within a specific component.
- Focus: Internal logic and data structures.
- Audience: Individual contributors working on specific modules.
- Key Elements:
- Classes, interfaces, methods, and attributes.
- Dependencies between code units.
While useful for complex algorithms, this level is often too detailed for high-level architecture. It changes too frequently and can clutter the broader picture. Use this level sparingly, only when a specific algorithm or data structure needs explanation.
📊 Comparing the Levels
To visualize the differences, consider the following breakdown of what each level communicates.
| Level | Question Answered | Typical Audience | Detail Level |
|---|---|---|---|
| System Context | What does the system do? | Stakeholders, PMs | High |
| Containers | What technology is used? | Developers, Ops | Medium |
| Components | How is functionality organized? | Developers | Low |
| Code | How does the logic work? | Specialized Developers | Very Low |
🤝 Why Teams Need This Framework
When everyone draws diagrams in their own style, communication breaks down. One developer might use a rectangle for a database, while another uses a cylinder. This creates friction during code reviews and onboarding. The C4 Model standardizes these visual representations.
Shared Mental Models
Consistency creates a shared mental model. When a team member sees a box, they know it represents a specific type of entity. This reduces the cognitive load required to understand a diagram. You do not need to decode the legend every time; the conventions are established.
Better Onboarding
New hires often struggle to understand the architecture of a large codebase. Reading through the code is slow. Having a set of C4 diagrams provides a roadmap. A new developer can start with the System Context Diagram to understand the ecosystem, then drill down into Containers to see how the application is split.
Improved Communication
Discussions about architecture often get stuck in the weeds. A Product Manager might ask about a feature, and a Developer might start talking about database indexes. Using the appropriate level of the diagram keeps the conversation on track. If the question is about integrations, look at Level 1. If it is about deployment, look at Level 2.
🛠️ Implementing the Model in Your Workflow
Adopting the C4 Model is not just about drawing; it is about integrating documentation into the development lifecycle. Here is how to make it practical.
Start Small
Do not attempt to document the entire system at once. Begin with the System Context Diagram for the current sprint or major feature. Get the boundaries right before adding detail. It is better to have a correct high-level view than a detailed one that is wrong.
Keep It Up to Date
A diagram that does not match the code is worse than no diagram at all. It creates a false sense of security. To maintain accuracy, link diagram updates to Pull Requests. If the architecture changes, the diagram must change. This ensures the documentation remains a source of truth.
Use Generic Tools
There are many diagramming tools available. The specific software does not matter as much as the consistency of the output. Choose a tool that supports version control. This allows diagrams to be stored alongside the code in the repository. It enables collaboration and tracking of changes over time.
Integrate with Documentation
Place the diagrams within your project documentation. Do not hide them in a separate repository. Ideally, the diagrams should be rendered directly in the markdown files or wiki pages that describe the system. This ensures they are visible when someone reads the README or technical specs.
🚫 Common Pitfalls to Avoid
Even with a good framework, teams often make mistakes. Being aware of these helps prevent waste and frustration.
1. Over-Engineering
Not every project needs all four levels. A small internal tool might only require a Container Diagram. Do not force complexity where it is not needed. Assess the size and complexity of the system before deciding how many levels to document.
2. Inconsistency
One of the biggest issues is inconsistent naming. If one diagram calls it the “User Service” and another calls it “User Module,” readers get confused. Maintain a glossary of terms. Ensure that every box, line, and label follows the same naming convention.
3. Ignoring the Audience
A common error is putting too much detail in the System Context Diagram. If you show database schemas in Level 1, you lose the high-level view. Stick to the purpose of each level. If the audience is management, do not show code logic.
4. Static Documentation
Some teams create diagrams once and forget them. Architecture is not static; it evolves. Regular reviews are necessary. Schedule a session every few months to validate the diagrams against the current state of the codebase.
👥 Roles and Diagram Usage
Different team members interact with the architecture differently. Understanding who needs what helps prioritize which diagrams to create and maintain.
| Role | Primary Diagram Level | Goal |
|---|---|---|
| Product Manager | System Context | Understand scope and integrations. |
| Technical Lead | Containers & Components | Design and review structure. |
| Backend Developer | Containers & Components | Implement specific functionality. |
| DevOps Engineer | Containers | Manage deployment and infrastructure. |
| Frontend Developer | Containers & Components | Understand API boundaries. |
🔄 Maintenance and Evolution
Documentation is a living artifact. It requires care to remain useful. Treat it like code. It should be reviewed, tested, and refactored.
Review Cycles
Integrate diagram reviews into your sprint planning or architecture review board. When a significant change is proposed, check the diagrams first. This ensures that the plan aligns with the visual representation. If the diagram does not reflect the plan, update it before writing code.
Automate Where Possible
Some tools can generate diagrams from code or configuration files. While manual drawing offers more flexibility for high-level concepts, automation ensures accuracy for lower levels. Consider using tools that sync with your repository to reduce the manual burden.
Feedback Loops
Encourage the team to provide feedback on the diagrams. If a developer finds a diagram confusing, fix it. If a stakeholder cannot understand a relationship, simplify it. The goal is clarity, not artistic perfection.
🌟 The Value of Simplicity
Complexity is the enemy of understanding. The C4 Model is not a complex framework; it is a tool to manage complexity. By breaking the system into layers, it allows the team to focus on one aspect at a time. This prevents the paralysis that often comes with trying to understand a massive system all at once.
When you design for the whole team, you are designing for success. You are reducing the time spent explaining the system and increasing the time spent building it. The diagrams become a reference point for decisions, a map for onboarding, and a shared language for collaboration.
Start with the context. Refine the containers. Define the components. Keep the code diagrams for when they are truly necessary. By following this structure, you build a foundation that supports growth and change. The architecture will evolve, but the method of understanding it will remain stable.
Remember, the goal is not perfect documentation. The goal is effective communication. If the team can look at a diagram and agree on how the system works, you have succeeded. Use the C4 Model to bring clarity to the chaos of software development.

