Designing complex distributed systems requires clear communication. As software architectures evolve towards cloud-native patterns, visual documentation becomes critical. The C4 model provides a structured approach to creating diagrams that scale with your system’s complexity. This guide explores how to apply the C4 model specifically to cloud-native environments.
Cloud-native architectures introduce unique challenges. Services are ephemeral, boundaries are fluid, and dependencies are numerous. Traditional static diagrams often fail to capture this dynamism. By adopting the C4 model, teams can maintain clarity without sacrificing detail. We will examine each level of the model, its application in modern infrastructure, and strategies for maintaining documentation integrity.
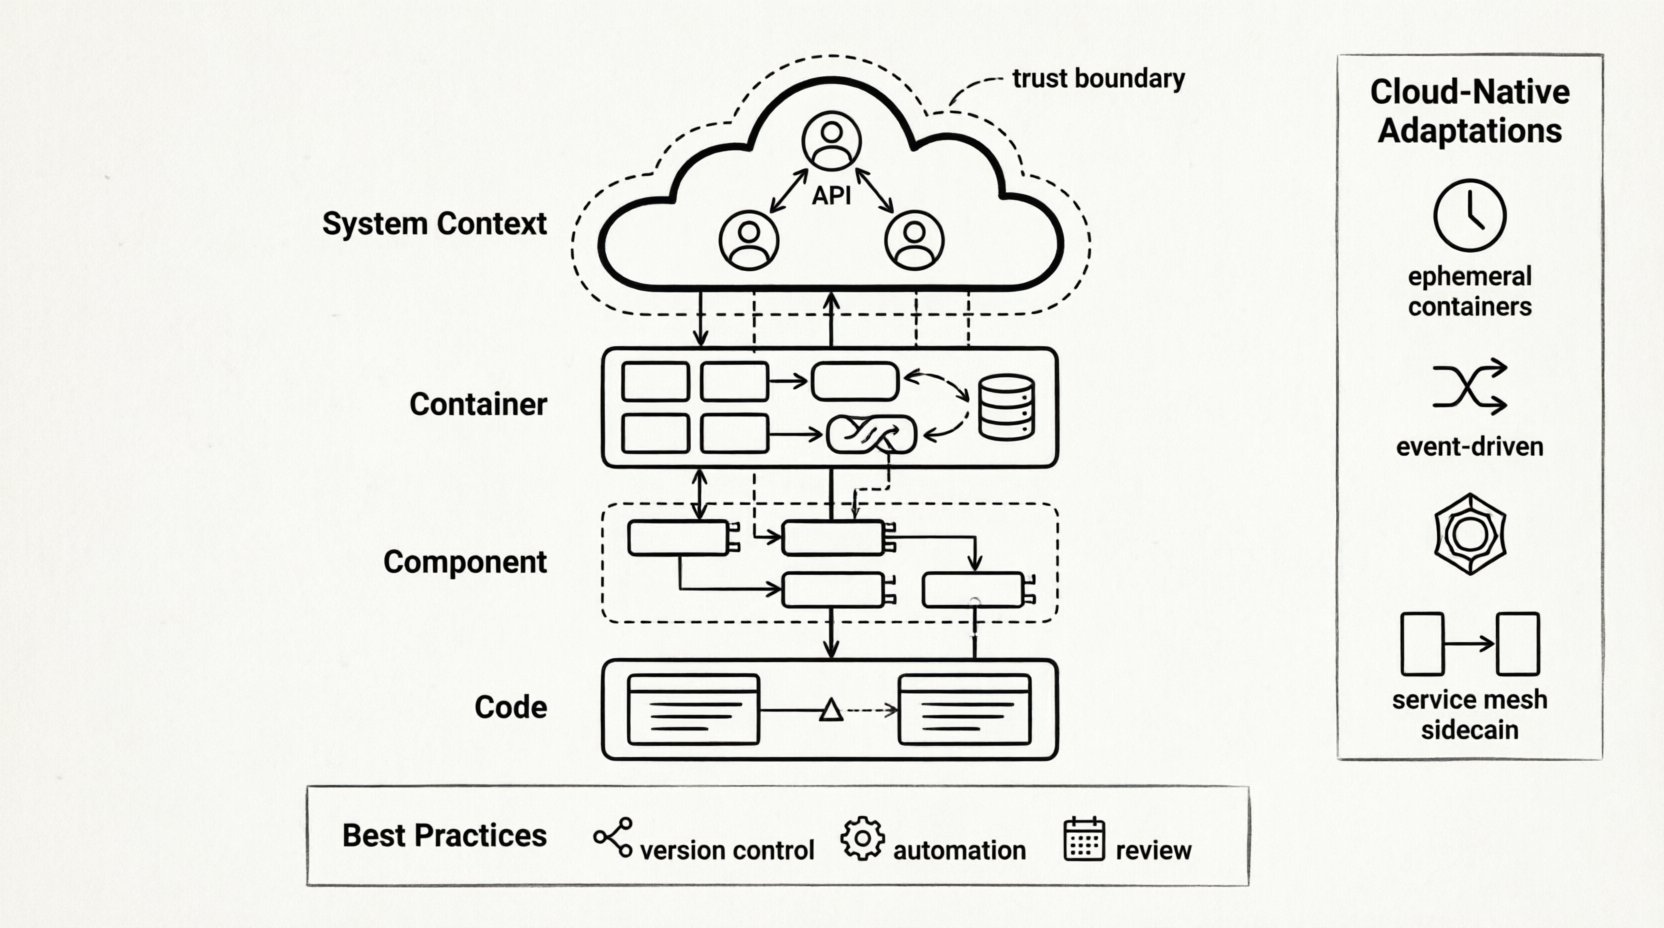
🧩 Understanding the C4 Model Levels
The C4 model organizes system design into four distinct levels. Each level serves a specific audience and provides a different granularity of information. This hierarchy prevents information overload while ensuring technical accuracy.
- Level 1: System Context – The big picture view.
- Level 2: Container – The deployment units.
- Level 3: Component – The internal logic.
- Level 4: Code – The implementation details.
Level 1: System Context Diagram
The System Context diagram places your software within the broader ecosystem. It identifies external actors and other systems that interact with your solution. In a cloud-native setting, this level is crucial for understanding data flow across organizational boundaries.
Key elements to include:
- Human Users: Administrators, customers, or operators interacting with the system.
- Software Systems: Third-party services, legacy databases, or partner APIs.
- Cloud Boundaries: Indicate if components reside in public, private, or hybrid clouds.
- Relationships: Show the direction and type of communication (e.g., HTTP, gRPC, asynchronous messaging).
For cloud-native projects, this diagram helps stakeholders visualize trust boundaries. It clarifies which data leaves the control of the organization and how external dependencies are managed.
Level 2: Container Diagram
The Container diagram breaks down the system into major building blocks. These are typically distinct processes or deployment units. In modern infrastructure, these correspond to microservices, serverless functions, or containerized applications.
Key considerations for cloud-native contexts:
- Deployment Units: Distinguish between containers, virtual machines, and serverless instances.
- Technology Stack: Note the primary technology used for each container (e.g., runtime language, database engine).
- Communication Protocols: Specify how containers talk to each other (internal API, message queues).
- Storage: Identify persistent storage requirements separate from the compute unit.
This level answers the question: “How is the system physically deployed?” It is the most critical diagram for DevOps and infrastructure teams planning scaling strategies.
Level 3: Component Diagram
Within a container, the Component diagram reveals internal structure. It shows how the functionality is divided into logical groups. This is where business logic and technical constraints intersect.
Focus areas for this level:
- Functional Groups: Group related functionality (e.g., Authentication, Billing, Notification).
- Interfaces: Define public and private interfaces between components.
- Responsibilities: Clarify what each component does without revealing implementation code.
- External Dependencies: List libraries or frameworks used within the component.
In microservices, this diagram often overlaps with API design. It helps developers understand the contract between services without needing to read the source code.
Level 4: Code Diagram
The Code level dives into class structures and implementation details. While valuable for specific modules, this level is often too granular for general architectural discussions. It is best used for onboarding new engineers to complex algorithms.
Guidelines for using this level:
- Target Audience: Senior developers or technical leads.
- Scope: Focus on critical paths or high-risk logic.
- Maintenance: These diagrams can become stale quickly; automate generation where possible.
| Level | Focus | Audience | Cloud-Native Context |
|---|---|---|---|
| System Context | Big Picture | Stakeholders, Architects | External APIs, Trust Boundaries |
| Container | Deployment Units | Developers, Ops | Microservices, Serverless, Containers |
| Component | Internal Logic | Developers | Service Modules, API Contracts |
| Code | Implementation | Engineers | Complex Algorithms, Logic Flows |
☁️ Adapting C4 for Cloud-Native Dynamics
Cloud-native architectures differ significantly from monolithic designs. Systems scale dynamically, instances are ephemeral, and state is often externalized. The C4 model must be adapted to reflect these realities.
Managing Ephemeral Resources
In traditional environments, a server exists for years. In cloud-native settings, containers may exist for minutes. Static diagrams can mislead if they imply permanence. When drawing Container diagrams:
- Indicate State: Show where state is held (e.g., external database, cache) versus where it is transient.
- Highlight Orchestration: Use notation to show that multiple instances of a container may run simultaneously.
- Focus on Services: Treat a service as an abstraction rather than a specific machine.
Handling Asynchronous Communication
Cloud-native systems often rely on event-driven architectures. Synchronous HTTP calls are common, but message queues are equally prevalent. Visualizing this flow requires specific conventions.
Best practices for asynchronous diagrams:
- Use Arrows for Events: Distinguish between request-response and fire-and-forget patterns.
- Label Queues: Clearly name the message broker or event stream.
- Denote Consumers: Show which services listen to specific events.
Scaling and Load Distribution
Diagrams should communicate how traffic is managed. Load balancers are fundamental components in cloud-native setups. They should be explicitly drawn in the Container level.
Include details on:
- Entry Points: API Gateways and Edge Services.
- Internal Routing: Service meshes or internal load balancers.
- Health Checks: Indicate mechanisms for removing unhealthy instances.
📊 Best Practices for Diagram Maintenance
A diagram that does not reflect reality is worse than no diagram at all. Cloud-native environments change rapidly. Maintenance strategies must be built into the development lifecycle.
Version Control Integration
Store diagram definitions alongside source code. This ensures that architectural changes trigger updates to the visual documentation. Use text-based diagram formats that can be versioned and diffed.
- Single Source of Truth: Keep the diagram file in the same repository as the code.
- CI/CD Checks: Integrate validation steps to ensure diagrams are updated during pull requests.
- Linking: Reference diagram versions in pull request descriptions.
Automating Where Possible
Manual drawing is prone to errors. Where feasible, generate diagrams from code metadata or configuration files.
Automation strategies:
- Infrastructure as Code: Generate Container diagrams from deployment manifests.
- API Documentation: Link API specifications to Component diagrams.
- Static Analysis: Use tools to extract component relationships from codebases.
Review Cycles
Set regular intervals for reviewing documentation. Architecture drift is inevitable. Schedule quarterly reviews to validate that diagrams match the deployed state.
- Owner Assignment: Designate specific engineers responsible for specific levels.
- Feedback Loops: Allow team members to suggest updates when they notice discrepancies.
- Deprecation: Mark obsolete diagrams clearly to prevent confusion.
🚫 Common Pitfalls to Avoid
Even with a solid framework, teams often fall into traps that reduce the value of architectural documentation. Awareness of these pitfalls helps maintain diagram quality.
Over-Engineering
Do not attempt to document every single class or configuration variable. The goal is communication, not exhaustive detail. Focus on the boundaries and interactions that matter most.
- Ignore Implementation Details: Focus on logic, not syntax.
- Simplify Relationships: If a relationship is trivial, omit it.
- Limit Scope: Do not try to draw the entire enterprise in one view.
Inconsistency
Using different notations across diagrams confuses readers. Establish a standard set of icons and colors for your organization.
- Standard Icons: Define what a “Database” or “User” looks like.
- Color Coding: Use colors consistently for security levels or environments.
- Naming Conventions: Ensure component names match code naming.
Stale Documentation
Outdated diagrams erode trust. If the diagram does not match the system, engineers will stop reading it.
- Update on Change: Require diagram updates as part of the definition of done.
- Remove Old Versions: Archive old diagrams to avoid confusion.
- Highlight Status: Add a “Last Updated” timestamp to every diagram.
🔗 Integrating with Team Workflows
Architectural diagrams are not just for architects. They are a communication tool for the entire engineering team. Integration into daily workflows ensures adoption.
Onboarding New Hires
New team members need a quick way to understand the system. The C4 model is ideal for this because it allows them to zoom in as needed.
- Level 1 for Day One: Show the System Context immediately.
- Level 2 for First Week: Explain how services interact.
- Level 3 for Specific Tasks: Provide Component diagrams when assigning tasks.
Incident Management
During outages, teams need to understand the impact quickly. Diagrams help trace failure paths.
- Visualizing Dependencies: Identify single points of failure.
- Tracing Requests: Follow a request through the Container diagram.
- Communication: Share relevant diagram sections with stakeholders.
Design Reviews
Use diagrams as the primary artifact during design discussions. It is easier to critique a visual representation than a text document.
- Whiteboarding: Start with sketches, then formalize into C4.
- Gap Analysis: Use diagrams to identify missing connections.
- Validation: Ensure proposed changes fit the existing architecture.
🛠️ Technical Considerations for Cloud-Native
Specific technical patterns in cloud environments require careful representation in the C4 model.
Service Meshes
Service meshes manage traffic between services. They add a layer of infrastructure that is often invisible to the application code but visible in the network.
- Sidecar Pattern: Represent sidecar proxies as part of the container.
- Traffic Management: Show routing rules and load balancing policies.
- Observability: Indicate where telemetry is collected.
Data Consistency
Distributed systems face consistency challenges. Diagrams should reflect data ownership.
- Ownership: Clearly state which service owns which data.
- Replication: Show where data is copied for performance.
- Sync vs Async: Distinguish between immediate and eventual consistency.
Security Boundaries
Security is paramount in cloud environments. Diagrams must highlight trust zones.
- Network Segments: Indicate public vs private subnets.
- Authentication: Show where authentication occurs (API Gateway vs Service).
- Encryption: Mark data in transit and at rest.
📝 Conclusion on Documentation Strategy
Effective documentation is a continuous process. The C4 model offers a flexible structure that adapts to the complexity of cloud-native systems. By focusing on the right level of detail and maintaining discipline around updates, teams can ensure their architecture remains understandable.
Remember that the goal is communication, not perfection. A simple diagram that is accurate is more valuable than a complex one that is outdated. Start with the System Context, refine the Container view, and add Component detail only where necessary. This approach keeps documentation manageable and useful for everyone involved.
Cloud-native architectures are dynamic. Your diagrams should be too. Treat them as living artifacts that evolve alongside your software. This mindset shift transforms documentation from a chore into a strategic asset for engineering efficiency.

