Software systems grow complex. Without a shared language, teams drift apart. Architecture diagrams often become outdated artifacts, gathering dust on wikis while the code evolves. The C4 Model offers a structured approach to visualization, focusing on clarity rather than exhaustive detail. This guide explores how to implement this methodology to improve communication, reduce cognitive load, and maintain a living documentation strategy.
🧩 Understanding the C4 Model
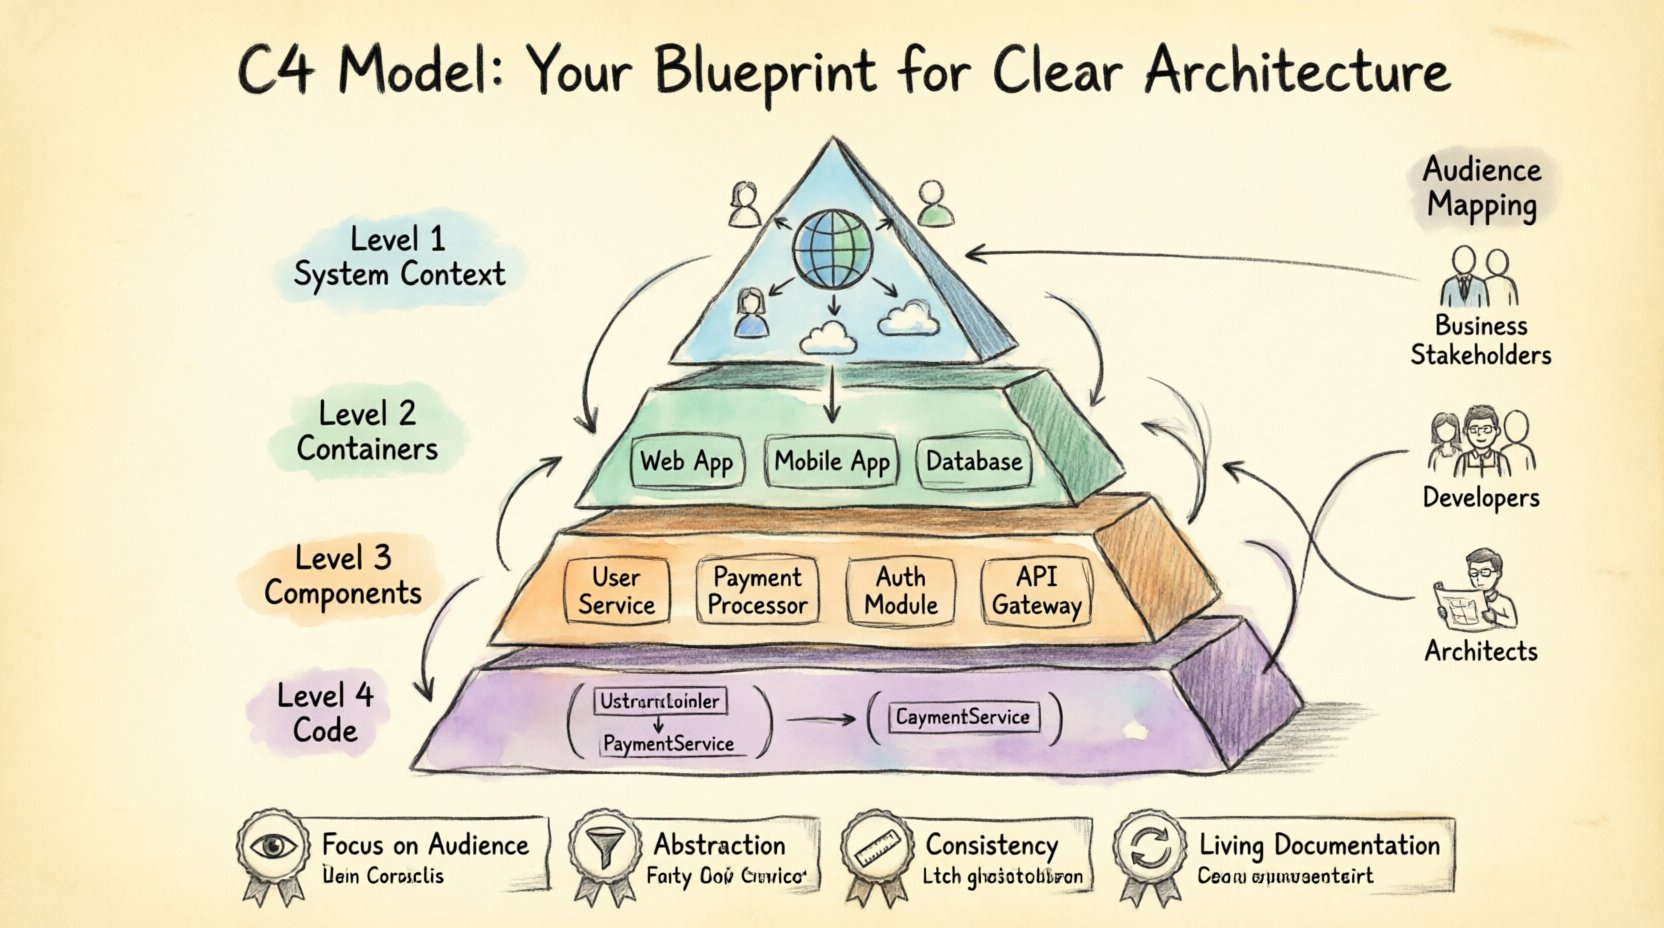
Developed by Simon Brown, the C4 Model provides a hierarchy of diagrams that describe software architecture from a high level down to the code. It addresses the common problem of trying to show everything at once, which usually results in cluttered, unreadable visuals. Instead, it encourages abstraction.
Key principles include:
- Focus on Audience: Different stakeholders need different levels of detail.
- Abstraction: Hide complexity where it does not matter for the current discussion.
- Consistency: Use standard shapes and symbols to avoid confusion.
- Living Documentation: Treat diagrams as code, subject to version control and updates.
By adhering to these principles, teams can create documentation that remains relevant throughout the software development lifecycle.
🌍 Level 1: System Context
The System Context diagram provides the highest level of abstraction. It answers the question: What is this system, and who interacts with it?
🔍 What to Include
- One System: Represent your application as a single box.
- Users: Identify people who use the system.
- Other Systems: Show external integrations and dependencies.
- Relationships: Draw lines to show data flow or interaction types.
🎯 Who Uses This?
Project managers, business stakeholders, and new hires rely on this view. It sets the scope without diving into technical implementation details.
⚠️ Common Pitfalls
- Too Many Systems: Do not include every microservice. Keep it to the external boundary.
- Confusing Users: Distinguish clearly between human users and automated systems.
- Over-specification: Do not list specific protocols or ports here.
📦 Level 2: Containers
Once the boundary is set, the Container diagram breaks down the main system into its constituent parts. A container is a deployable unit, such as a web application, mobile app, database, or cloud function.
🔍 What to Include
- Deployable Units: Identify the runtime environments.
- Technologies: Briefly note the technology stack (e.g., “Node.js”, “PostgreSQL”).
- Interactions: Show how containers communicate (HTTP, gRPC, queues).
- Users: Map which users interact with which containers.
🎯 Who Uses This?
Developers, DevOps engineers, and technical architects use this to understand the infrastructure and deployment topology.
⚠️ Common Pitfalls
- Over-fragmentation: Do not split a single microservice into multiple containers unless they are distinct deployable units.
- Ignoring Data: Ensure data stores are clearly marked as containers, not just internal components.
- Missing Dependencies: Show external APIs that this container relies upon.
⚙️ Level 3: Components
The Component diagram zooms in further. It describes the high-level logical building blocks within a container. This is where the internal logic of a specific service is visualized.
🔍 What to Include
- Logical Blocks: Group functionality (e.g., “User Service”, “Payment Processor”).
- Interfaces: Define inputs and outputs between components.
- Relationships: Show dependencies between components.
- Responsibilities: Briefly describe what each component does.
🎯 Who Uses This?
Backend developers and system designers use this to understand how code is organized and how services interact internally.
⚠️ Common Pitfalls
- Code-Level Detail: Do not list classes or methods. Keep it logical.
- Missing Context: Ensure the component still relates back to the container it resides in.
- Complex Connections: Avoid spaghetti lines. Use grouping if connections become too dense.
💻 Level 4: Code
The Code level is the most detailed. It typically maps to the actual class structure, method signatures, and database schemas. However, the C4 Model suggests using this level sparingly.
🔍 What to Include
- Classes: Key classes that define the core logic.
- Methods: Significant operations performed by those classes.
- Attributes: Data fields stored within the class.
- Relationships: Inheritance, composition, and association.
🎯 Who Uses This?
Senior developers and new team members joining a specific module use this for deep dives into implementation.
⚠️ Common Pitfalls
- Maintaining Code Diagrams: These require constant updates as code changes. Automate where possible.
- Over-Engineering: If a diagram is too detailed, it becomes unreadable quickly.
- Ignoring Abstraction: Sometimes a class diagram is not needed if the code is self-documenting.
👥 Mapping Audiences to Diagrams
One of the greatest strengths of this approach is matching the right diagram to the right person. A single diagram rarely satisfies everyone.
| Role | Recommended Level | Focus Area |
|---|---|---|
| Business Stakeholders | Level 1 (System Context) | Value proposition, external integrations |
| Project Managers | Level 1 & 2 | Scope, dependencies, high-level structure |
| Developers | Level 2 & 3 | Service boundaries, logical flow, API contracts |
| DevOps / SRE | Level 2 | Deployment units, runtime environment, infrastructure |
| Architects | Level 2 & 3 | System boundaries, data flow, integration patterns |
| New Hires | Level 1 | Quick onboarding, understanding the ecosystem |
🛠️ Best Practices for Sustainable Documentation
Documentation often fails because it is too hard to maintain. Here are strategies to ensure your architecture diagrams remain useful.
📝 Version Control
Treat diagrams as code. Store them in your version control system alongside the application code. This ensures:
- History of changes is tracked.
- Reviews happen before merging.
- Rollbacks are possible if a diagram becomes confusing.
🔄 Automated Generation
Where possible, generate diagrams from code annotations or configuration files. This reduces the manual effort required to keep them up to date.
🎨 Consistency in Style
Define a style guide for your diagrams. Use the same shapes, colors, and fonts across all levels. This reduces the cognitive load when switching between diagrams.
🗺️ Navigation Structure
Ensure there is a clear path from Level 1 down to Level 4. Avoid jumping levels. If a Level 2 diagram references a Level 3 component, link to that specific diagram.
🔄 Keeping Diagrams Fresh
The biggest enemy of documentation is the passage of time. Code changes, and if the diagram does not, it becomes a lie.
📅 Scheduled Reviews
Set a recurring calendar event to review critical diagrams. Ask:
- Does this still reflect the current state?
- Are there new dependencies that need adding?
- Is any part of the diagram confusing to a new team member?
🚀 Integration with CI/CD
Incorporate diagram checks into your pipeline. If the code structure changes significantly, trigger a notification to the team to update the documentation. This creates a feedback loop between implementation and documentation.
🚫 The “Good Enough” Principle
Do not strive for perfection. A diagram that is 80% accurate and updated regularly is better than a 100% accurate diagram that is two years old. Focus on the most critical paths and major changes.
🔄 Integrating into Development Workflows
Documentation should not be a separate activity. It must be woven into the daily work of the engineering team.
📋 Pull Requests
When a significant architectural change occurs, require a diagram update in the pull request. This forces the author to think about the visual impact of their change before committing code.
🗣️ Team Meetings
Use diagrams during planning and retrospective meetings. They provide a common reference point that helps align the team on what is being built and why.
📚 Knowledge Base
Host your diagrams in a central knowledge base. Ensure they are accessible to all team members, including those who are not developers but need to understand the system.
🌐 The Cognitive Load of Architecture
Why do we need levels? The human brain has limits on how much information it can process at once. A single diagram showing every class, database, and user is overwhelming. It fails to convey the system’s structure.
The C4 Model respects cognitive limits by:
- Progressive Disclosure: Show less at first, more when needed.
- Contextual Relevance: Provide information based on the user’s current task.
- Visual Hierarchy: Use size and color to indicate importance.
By managing cognitive load, you enable faster decision-making and reduce the risk of miscommunication. When everyone understands the diagram, they understand the system.
📉 Handling Complexity and Scale
As systems grow, so does the complexity of the diagrams. Large organizations often have hundreds of containers and thousands of components. Managing this scale requires discipline.
🔗 Linking Diagrams
Use hyperlinks to jump between diagrams. Do not try to fit everything on one page. A Level 2 diagram should link to specific Level 3 diagrams for each container.
🗂️ Modular Documentation
Break documentation into modules. A “Payment Module” might have its own set of diagrams separate from the “User Module”. This allows teams to focus on their specific area without being distracted by unrelated parts of the system.
🚦 Status Indicators
Use visual indicators to show the health or status of components. This can be done within the diagram to highlight deprecated features or services under heavy load.
🚧 Common Challenges and Solutions
Implementing this model comes with challenges. Here is how to address them.
Challenge: Resistance to Change
Solution: Show value. Start with a small team. Demonstrate how the diagrams reduce onboarding time or speed up debugging.
Challenge: Lack of Time
Solution: Automate. Use tools to generate diagrams from code. If automation is not possible, prioritize critical paths first.
Challenge: Inconsistent Standards
Solution: Create a style guide. Conduct workshops to train team members on the shapes and symbols used.
🛠️ Tools and Platforms
While the model is tool-agnostic, the ecosystem supports various platforms. The choice of tool depends on your team’s workflow.
- Cloud-Based: Good for collaboration and real-time updates.
- Local: Good for security and offline work.
- Code-Based: Good for integration with CI/CD and version control.
Regardless of the tool, the focus must remain on the content and clarity, not the features of the software used to create it.
🔄 Continuous Improvement
Documentation is never finished. It is a continuous process of refinement. Regularly solicit feedback from the team. Ask them what is missing and what is confusing.
Adapt the diagrams to the specific needs of your organization. Some teams may need more focus on security boundaries, while others may prioritize data flow. The model provides the structure; your team provides the content.
🏁 Final Thoughts
Clear architecture is the foundation of maintainable software. The C4 Model provides a proven framework to achieve this clarity. By focusing on abstraction, audience, and maintenance, you can transform documentation from a chore into a strategic asset.
Start small. Create a Level 1 diagram. Get feedback. Iterate. Over time, you will build a living library of diagrams that guides your team through the complexity of modern software systems. The goal is not perfection, but understanding.

