Software systems grow complex. As applications evolve, the diagrams that once explained them become outdated, confusing, or useless. Teams struggle to understand how data flows, where services connect, or what changes impact specific features. This lack of shared understanding leads to technical debt, deployment errors, and slowed development velocity.
The C4 Model offers a structured approach to software architecture. It provides a framework for creating diagrams that communicate system design at different levels of detail. By focusing on context, containers, components, and code, this model helps developers and stakeholders visualize the system without getting lost in unnecessary complexity.
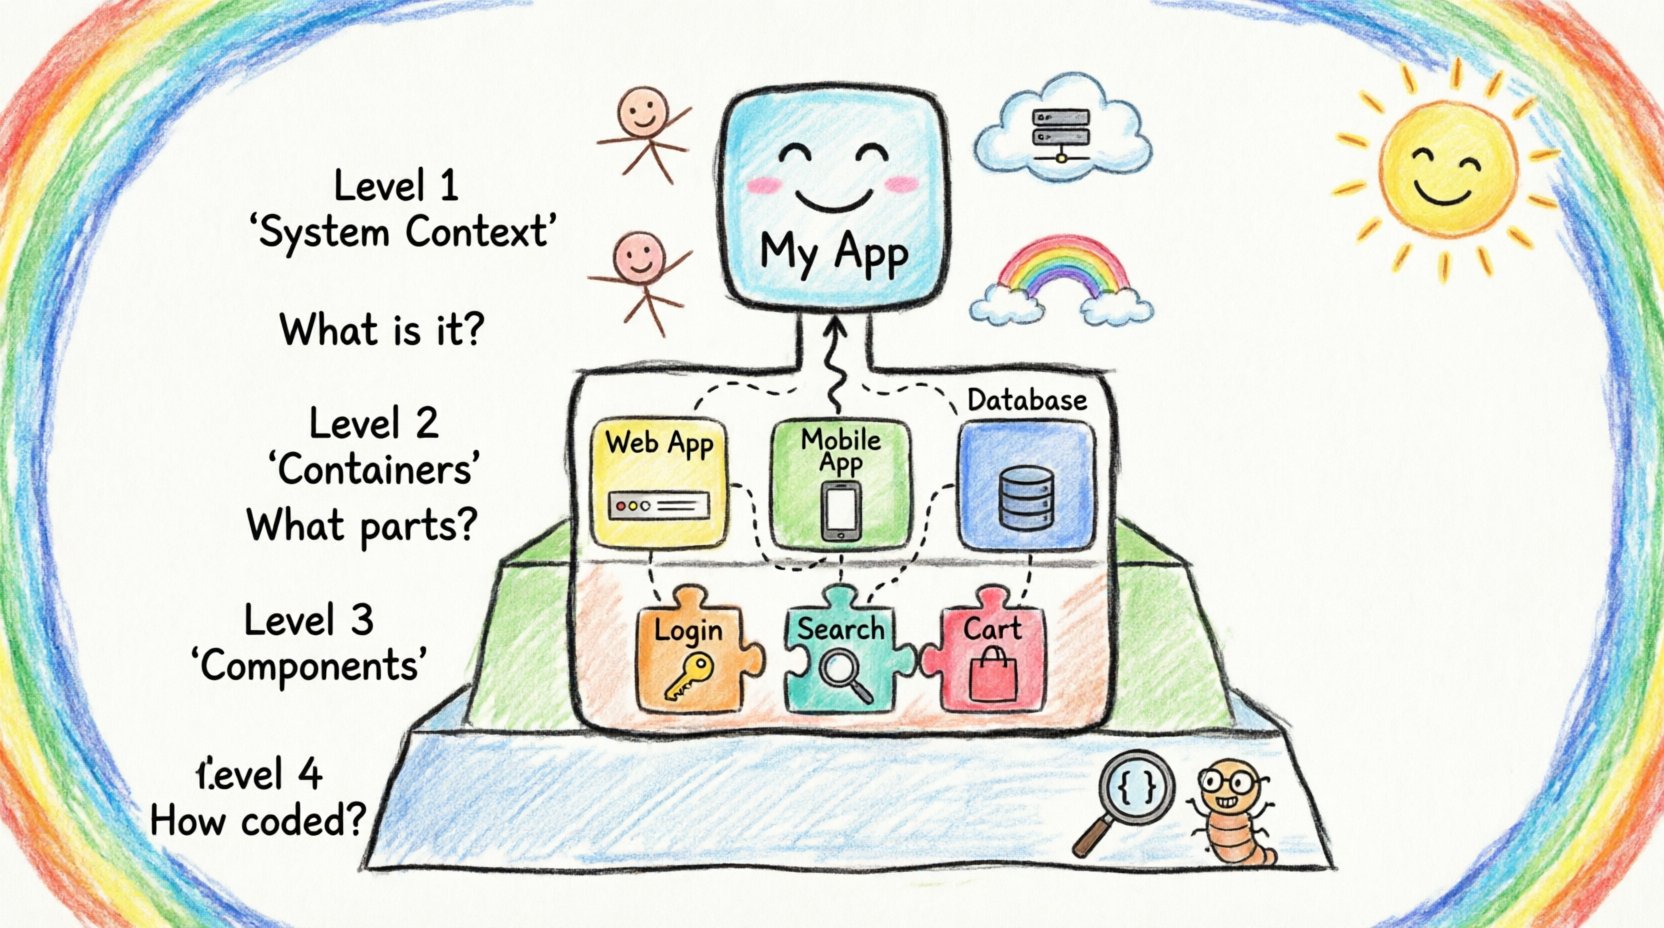
🧩 What is the C4 Model?
The C4 Model is a hierarchical approach to software architecture documentation. It organizes diagrams into four distinct levels of abstraction. Each level serves a specific purpose and targets a specific audience. The goal is not to document every detail, but to provide the right information at the right time.
Unlike traditional Unified Modeling Language (UML) diagrams, which often become too detailed too quickly, the C4 Model encourages high-level conceptualization first. This prevents the documentation from becoming a burden that requires constant maintenance. Instead, the diagrams remain useful throughout the lifecycle of the software.
Key principles include:
- Abstraction: Hide complexity where it is not needed.
- Consistency: Use standard notation across all diagrams.
- Maintainability: Keep diagrams updated alongside the code.
- Clarity: Ensure the diagram explains the system, not just the syntax.
📊 The Four Levels of Abstraction
Understanding the hierarchy is crucial for effective communication. The model moves from the broadest view to the most detailed. Each level answers a specific question about the system.
| Level | Name | Primary Question | Target Audience |
|---|---|---|---|
| 1 | System Context | What is the system and who uses it? | Stakeholders, Managers, New Joiners |
| 2 | Containers | How is the system built? | Developers, Architects, DevOps |
| 3 | Components | What are the key parts inside containers? | Developers, Technical Leads |
| 4 | Code | How are components implemented? | Developers, Reviewers |
🌍 Level 1: System Context
The System Context diagram provides the widest view. It shows the software system as a single box. This box represents the boundary of the application in question. Surrounding this box are external systems and users.
This diagram answers the question: How does this system fit into the wider ecosystem? It identifies:
- People: Users, administrators, or external actors interacting with the system.
- Systems: Other applications, databases, or services that communicate with the system.
- Relationships: How data flows between the system and these external entities.
For example, if you are designing an online store, the System Context diagram shows the store application, the customer, the payment provider, and the inventory system. It does not show the internal code or servers. It focuses purely on the external interactions.
Best practices for Level 1:
- Keep it to a single page.
- Use simple boxes and arrows.
- Define clear boundaries for what is inside and outside the system.
- Update this diagram whenever a new external dependency is added.
📦 Level 2: Containers
Once the context is understood, the next step is to break down the system. The Container level shows the high-level building blocks. Containers are distinct, deployable units of software. Examples include web applications, mobile apps, microservices, databases, or file systems.
This diagram answers the question: What technologies are used to build the system? It bridges the gap between business requirements and technical implementation.
Key elements include:
- Application Types: Web apps, mobile apps, batch jobs.
- Technologies: Programming languages, frameworks, or database types.
- Connections: Protocols like HTTP, gRPC, or SQL used to connect containers.
When creating a Container diagram, avoid showing every microservice if the number is too high. Group related services if necessary. The goal is to show the architectural boundaries, not the deployment topology.
Consider the following guidelines:
- Group services by function or domain.
- Label containers with their primary technology stack.
- Highlight critical data flows between containers.
- Ensure the diagram remains readable when printed or viewed on small screens.
⚙️ Level 3: Components
As we drill deeper, the Component level focuses on the internal structure of a container. A component is a distinct part of a software system that implements a specific function. Examples include a user authentication module, a reporting engine, or a caching layer.
This diagram answers the question: How does the code organize itself to achieve its goals? It is typically the most detailed diagram in the architecture documentation.
Components are defined by their interfaces. They do not show internal logic, data structures, or class relationships. Instead, they show:
- What the component does.
- How it interacts with other components.
- External systems it relies on.
For instance, inside a web application container, a component might represent the API gateway. Another component might handle database persistence. A third might manage user sessions. The Component diagram maps the relationships between these logical units.
To maintain clarity at this level:
- Limit the number of components per container (usually 10 to 15).
- Focus on public interfaces and data stores.
- Use consistent naming conventions.
- Ensure the diagram explains the architectural intent, not the implementation details.
💻 Level 4: Code
The Code level is optional. It maps the Component diagram to the actual source code. This is where you show classes, methods, and interfaces.
Most teams find this level unnecessary for high-level architecture documentation. It is too detailed and changes too frequently. However, it can be useful for:
- Onboarding new developers to a specific module.
- Explaining complex algorithms or data structures.
- Documenting critical security boundaries within the code.
If you choose to use Level 4, ensure it is generated or maintained automatically. Manual updates to code-level diagrams rarely survive the pace of software development.
🎨 Visual Notation Standards
Consistency is the backbone of the C4 Model. If every diagram uses a different style, the documentation becomes confusing. The model defines a standard notation for boxes, lines, and labels.
Standard elements include:
- Boxes: Represent systems, containers, components, or code units.
- Arrows: Represent data flow or dependencies.
- Labels: Describe the relationship or the technology used.
For example, a line connecting a web application to a database should be labeled with the protocol, such as HTTPS or SQL. A box representing a user should be labeled with their role, such as Customer or Admin.
Color coding can be helpful, but it should be used sparingly. Use color to indicate status, risk, or ownership, not just aesthetics. For example, red might indicate a deprecated system, while green indicates a stable service.
🚀 Benefits for Engineering Teams
Adopting this structured approach brings tangible improvements to the engineering workflow. It is not just about drawing pictures; it is about improving communication.
Shared Understanding
When everyone uses the same notation, misunderstandings decrease. A developer in one team can look at a diagram and understand the architecture of a system they do not own. This reduces the dependency on specific individuals for knowledge transfer.
Better Documentation
Because the model encourages high-level abstractions, the documentation remains relevant longer. Instead of updating thousands of lines of text, teams update a few diagrams. This reduces the cost of documentation maintenance.
Risk Identification
Visualizing connections helps identify risks early. For example, a diagram might reveal that a single database is a bottleneck for multiple services. Or it might show that a critical dependency is external and potentially unstable. These insights allow teams to mitigate risks before they become incidents.
Onboarding Efficiency
New hires can grasp the system landscape much faster with clear diagrams. They can start contributing code without needing to read through months of history or rely entirely on verbal explanations.
🛠️ Implementation Strategy
Introducing this framework requires a plan. It is not a switch that flips overnight. Teams need to adopt it gradually.
Start with Context
Begin with Level 1 diagrams. Create a System Context diagram for the main project. This sets the baseline. Ensure all stakeholders agree on what is inside the boundary and what is outside.
Expand Gradually
Once the context is stable, move to Level 2. Create Container diagrams for critical systems. Do not attempt to document every system in the organization at once. Focus on the most complex or critical ones first.
Integrate with Workflows
Documentation should not be a separate task. Integrate diagram creation into the pull request process. When a major architectural change occurs, the diagram must be updated. This ensures the documentation stays in sync with the code.
Tooling Selection
Choose tools that support the standard notation. There are various platforms available that generate diagrams from code or configuration. This ensures that the diagrams are not manually drawn and prone to errors. Look for tools that allow version control integration.
🔄 Maintenance and Evolution
Software changes. Requirements shift. Technologies evolve. The diagrams must reflect these changes.
Versioning
Treat diagrams as code. Store them in the version control system alongside the application code. This allows teams to see the history of architectural changes. It also enables rollbacks if a change proves problematic.
Review Cycles
Schedule regular reviews of the diagrams. During these sessions, check for outdated labels, broken connections, or missing components. This keeps the documentation accurate over time.
Deprecation
When a container or component is removed, update the diagram immediately. Mark deprecated items clearly. This prevents new developers from relying on old interfaces.
🚫 Common Pitfalls to Avoid
Even with a solid framework, teams can make mistakes. Being aware of these pitfalls helps avoid common traps.
- Too Much Detail: Trying to put everything into one diagram defeats the purpose. Stick to the hierarchy.
- Ignoring the Audience: A diagram for a manager should not be the same as one for a developer. Tailor the abstraction level to the reader.
- Static Documentation: If the diagram is not updated, it becomes misleading. Never trust a diagram that has not been reviewed in months.
- Over-Engineering: Do not create diagrams for every small feature. Focus on the architecture, not the implementation of a single ticket.
- Ignoring Relationships: Focus only on boxes and miss the data flow. The connections are often more important than the boxes themselves.
🤝 Integrating with Process
Documentation must be part of the delivery pipeline. It should not be an afterthought. Here is how to integrate it into the development lifecycle.
Design Phase
During the design phase, create the initial diagrams. Use them to validate the architecture before writing code. This ensures the team agrees on the solution.
Development Phase
As code is written, verify that it matches the diagram. If the code diverges significantly, update the diagram. This keeps the documentation as a source of truth.
Code Review
Include diagrams in code review requests for major changes. Reviewers should check if the architectural intent is preserved. This encourages accountability.
Post-Implementation
After deployment, review the diagrams to ensure they reflect the live system. Check for any runtime changes that were not anticipated during the design phase.
🔍 Deep Dive: Audience Alignment
One of the most powerful aspects of this model is its ability to address different audiences simultaneously. A single system might require different views for different people.
- Executives: They need Level 1. They care about business value and external dependencies. They do not need to know about containers.
- Project Managers: They need Level 1 and Level 2. They need to understand the boundaries and the major technology blocks to plan resources.
- Developers: They need Level 2 and Level 3. They need to know how to integrate their code and where the data lives.
- DevOps: They need Level 2. They need to know the deployment units and infrastructure requirements.
By providing these distinct views, you avoid overwhelming the audience with irrelevant information. This targeted communication improves decision-making speed.
🏁 Summary
Software architecture is a communication challenge as much as a technical one. The C4 Model provides a proven method to navigate this challenge. It structures information into manageable levels, ensuring that the right people see the right details.
By adopting this framework, teams can reduce complexity, improve onboarding, and maintain accurate documentation. It turns a static set of drawings into a living representation of the system. This clarity leads to better software, fewer errors, and a more efficient development process.
Start with the System Context. Build up from there. Keep it simple. Keep it updated. Let the diagrams guide the engineering journey.

