Understanding how a software system functions requires more than just looking at code. It demands a clear visualization of interactions between components over time. Sequence diagrams offer a powerful lens for this analysis. They map out the chronological flow of messages, allowing engineers and stakeholders to see the lifecycle of an operation from start to finish. This guide explores the depth of analyzing system behavior using these diagrams, focusing on structure, logic, and validation without relying on specific tools.
🧩 The Foundation of Behavioral Modeling
When building complex systems, static structure tells you what exists, but dynamic behavior tells you how it works. A sequence diagram captures this dynamic aspect. It represents a scenario where participants exchange messages. These participants can be objects, classes, external systems, or users.
The primary goal is to trace the path of data and control. By mapping these paths, teams can verify if the system adheres to requirements. It serves as a blueprint for logic flow. Here are the core elements that form the backbone of any sequence analysis:
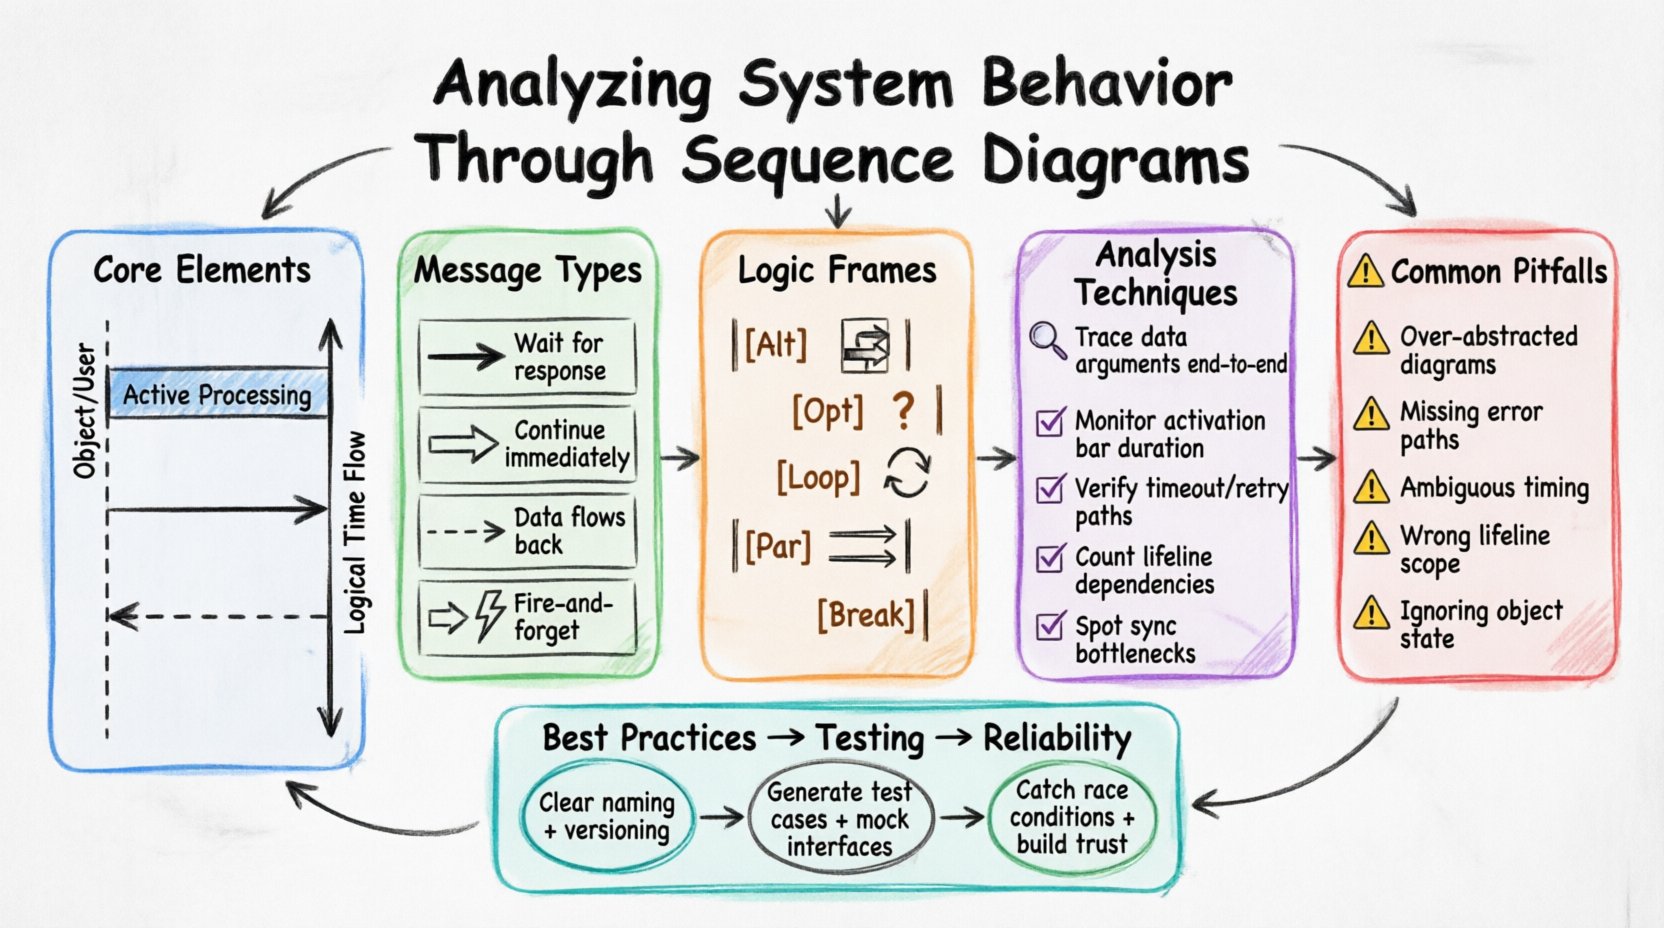
- Lifelines: Vertical dashed lines representing the existence of a participant. They show the timeline of an object or system.
- Activation Bars: Rectangles on a lifeline indicating when an object is actively performing an operation. This shows duration of control.
- Messages: Arrows connecting lifelines. They represent calls, returns, or signals passed between components.
- Time Flow: Movement from top to bottom. Time is not linear in seconds, but in logical order of events.
Each element contributes to a narrative. The narrative answers the question: “What happens when X triggers Y?” This narrative is critical for debugging and design validation.
🔄 Message Types and Interaction Flows
Not all messages are created equal. Distinguishing between them is vital for accurate behavior analysis. The type of message dictates how the receiving component processes the request and when control returns.
Below is a breakdown of common message types found in behavioral analysis:
| Message Type | Visual Representation | Behavioral Implication |
|---|---|---|
| Synchronous Call | Filled Arrowhead | Sender waits for the receiver to finish before proceeding. |
| Asynchronous Call | Open Arrowhead | Sender continues immediately without waiting for a response. |
| Return Message | Dashed Arrow | Data or control flows back to the caller. |
| Signal | Open Arrowhead (No Wait) | Fire-and-forget notification. No response expected. |
Understanding these distinctions prevents architectural bottlenecks. For instance, if a high-frequency task sends a synchronous call to a slow database, the entire system may stall. Asynchronous messaging often resolves this by decoupling the sender from the receiver’s processing time.
🧱 Structuring Complex Logic with Frames
Real-world systems rarely follow a single straight path. They involve conditions, loops, and parallel processes. Sequence diagrams handle this complexity through frames. Frames group interaction fragments and define specific rules for execution.
Here is how different frames influence system behavior analysis:
- Alt (Alternative): Represents conditional logic (If/Else). It allows the diagram to show different paths based on boolean conditions. This is essential for validating error handling and branching logic.
- Opt (Option): Similar to Alt, but implies a condition that may or may not be true. It highlights optional features or rare events.
- Loop: Indicates repetition. This is useful for analyzing batch processing, pagination, or waiting for retries.
- Par (Parallel): Shows concurrent interactions. Multiple lifelines proceed simultaneously. This is critical for identifying race conditions or threading issues.
- Break: Represents an abort or exception path. It shows how the system exits a normal flow due to an error.
When analyzing a system, looking at the Alt frames is often where the most significant logic bugs reside. Do the conditions cover all cases? Is the fallback mechanism robust? These frames turn a simple flowchart into a comprehensive logic map.
🔍 Techniques for Effective Analysis
Reading a diagram is passive; analyzing it is active. To derive value, one must interrogate the diagram. Here are methods to deepen the analysis:
- Trace Data Integrity: Follow the message arguments. Does the data passed in the first message reach the final destination unchanged? If transformations occur, are they documented?
- Check Resource Acquisition: Look for activation bars. Are resources held too long? Long activation bars on a database connection indicate potential locking issues.
- Verify Timeout Handling: Does the diagram account for delays? If a service is down, does the flow show a retry or a failure state? If not, the system is fragile.
- Assess Coupling: Count the number of dependencies between lifelines. High connectivity suggests tight coupling. A robust system often has fewer direct dependencies between major components.
- Identify Bottlenecks: Look for synchronous calls in the middle of a critical path. These are potential points of failure that slow down the whole chain.
By applying these techniques, the diagram transforms from a picture into a diagnostic tool. It reveals hidden dependencies and logic gaps that code reviews might miss.
⚠️ Common Pitfalls in Behavioral Representation
Even with a solid understanding of notation, errors creep in during the creation and analysis phase. Recognizing these pitfalls ensures the diagram remains a reliable artifact.
Consider the following common issues:
- Over-Abstraction: Showing too many steps at once makes the diagram unreadable. It becomes a wall of text. Grouping related steps into subsystems helps maintain clarity.
- Missing Error Paths: Many diagrams only show the “Happy Path”. This is insufficient for production systems. Analyzing failure scenarios is just as important as analyzing success.
- Ambiguous Timing: Using terms like “soon” or “later” without context. In sequence diagrams, time is logical. Be precise about order. If order does not matter, use
Parframes explicitly. - Incorrect Lifeline Scope: Creating lifelines for variables that do not persist. Lifelines should represent entities that exist for the duration of the interaction.
- Ignoring State: A sequence diagram does not show the state of an object explicitly. Two calls to the same object might behave differently based on its internal state. Analysts must keep this context in mind.
📝 Documentation Standards for Clarity
To make sequence diagrams useful for future analysis, they must adhere to documentation standards. A well-documented diagram saves time for developers and testers alike.
Key standards include:
- Consistent Naming: Use clear names for messages. Instead of “Process”, use “ValidateUserCredentials”. This aids in traceability to requirements.
- Logical Grouping: Use combined fragments to group logic. Don’t scatter related steps across the page.
- Versioning: If a behavior changes, the diagram should reflect the new state. Outdated diagrams cause more confusion than no diagrams at all.
- Context Notes: Add notes explaining the preconditions. What state must the system be in before this sequence starts?
🧪 Integration with Testing Strategies
Sequence diagrams are not just for design; they bridge the gap to testing. They provide the scenarios needed for integration testing.
Here is how they integrate:
- Test Case Generation: Each path in the diagram can become a test case. The “Happy Path” becomes the primary test. The
Breakframes become negative tests. - Mocking Interfaces: The diagram defines the interface contracts. Testers can mock the external lifelines based on the message definitions.
- Regression Analysis: When code changes, the diagram helps identify which behaviors might be affected. If a message flow changes, the corresponding tests must be updated.
This integration ensures that the documented behavior matches the implemented behavior. It reduces the gap between design and reality.
🚀 Enhancing System Reliability
Ultimately, the goal of analyzing system behavior is reliability. A system that behaves predictably is a system that users trust. Sequence diagrams contribute to this by forcing designers to think through every interaction.
When you analyze a sequence diagram, you are asking: “Can this system handle this load? Can it handle this failure? Does it do the right thing in this order?” These questions drive better architecture.
By focusing on the flow of control and data, teams can identify race conditions, deadlocks, and data inconsistencies before they reach production. The visual nature of the diagram allows non-technical stakeholders to participate in the review process, ensuring business logic is correctly implemented.
Continuous refinement of these diagrams leads to a more maintainable codebase. When developers understand the intended flow, they write code that aligns with that flow. This alignment reduces technical debt over time.
Remember that diagrams are living documents. They should evolve as the system evolves. A static diagram is a relic. A dynamic analysis process keeps the system healthy.

